What Is Qualitative Data Analysis? A Practical Guide
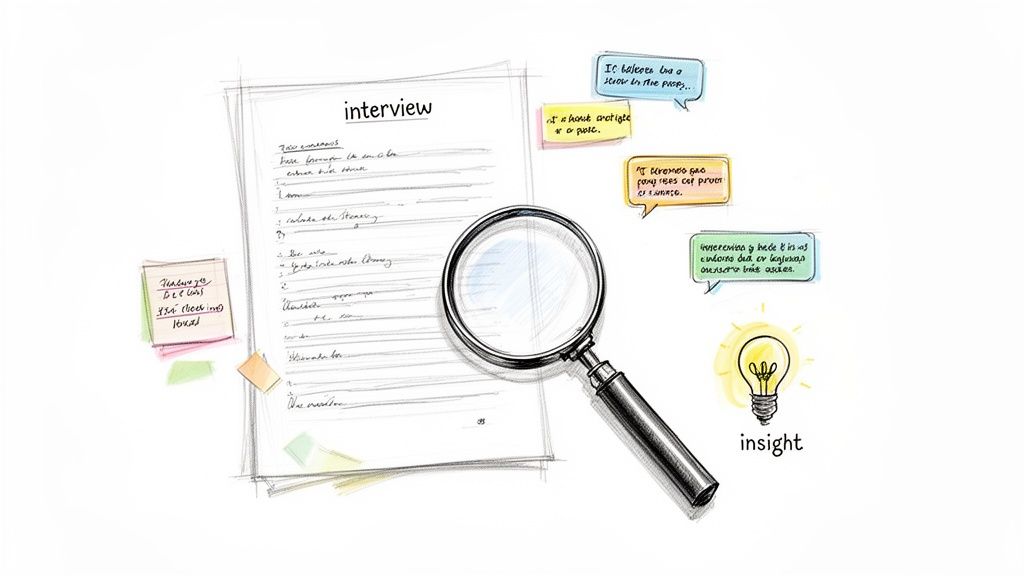
Qualitative data analysis is what happens when you move beyond the numbers to understand the stories, feelings, and motivations behind them. It’s the process of taking messy, human information—like interview transcripts, open-ended survey responses, or customer support chats—and finding the meaningful patterns hidden within.
Instead of just counting what people do, this process helps you explore why they do it. It’s less about spreadsheets and more about interpretation, helping you answer complex questions that numbers alone can't touch.
Understanding the Core of Qualitative Analysis
Think of yourself as a detective sifting through clues. You’ve got witness statements, diary entries, and scraps of conversations. Your job isn't to count how many times a certain word was said, but to piece together the narrative, understand the motives, and see the bigger picture emerge. That’s the heart of qualitative data analysis.
This approach is invaluable when you need to grasp context, emotion, and the subtle nuances of human experience. A product team, for example, might use it to figure out why users are frustrated with a new feature. The data won't be a simple "yes" or "no" but a rich collection of feelings and pain points that numbers alone could never reveal.
Exploring the 'Why,' Not Just the 'What'
Qualitative data is descriptive and messy by nature. It’s captured through methods like in-depth interviews, focus groups, and direct observation. The goal isn’t to generalize findings to an entire population, but to gain a deep, detailed understanding of a specific group or phenomenon.
While it feels modern, this method is a long-standing pillar of social science. Its structured form really started taking shape in the mid-20th century, with major steps like the Framework Approach in the 1980s offering researchers a more systematic way to manage interview data. Today, technology has become a key partner; a 2023 study showed that 68% of social science researchers now use AI-assisted tools in their work, a huge leap from just 22% in 2015. You can read more about the history and evolution of qualitative analysis on getthematic.com.
Qualitative analysis gives a voice to your data. It helps you step into your participants' shoes to understand the world from their perspective, revealing the rich context behind their behaviors and opinions.
Qualitative vs. Quantitative: A Tale of Two Approaches
The easiest way to really get a handle on qualitative analysis is to see it side-by-side with its counterpart: quantitative analysis. One explores depth and meaning, while the other is all about measurement and statistics. Neither is inherently better—they just answer very different questions.
To make the distinction crystal clear, let’s break it down.
Qualitative vs Quantitative Data Analysis at a Glance
This table provides a quick look at how these two approaches differ in their goals, data, and the kinds of questions they seek to answer.
| Aspect | Qualitative Analysis | Quantitative Analysis |
|---|---|---|
| Primary Goal | To explore and understand underlying reasons, opinions, and motivations. | To measure and test hypotheses, quantify problems, and generalize results. |
| Data Type | Non-numerical data (text, video, audio, observations). | Numerical data and statistics (counts, measurements, ratings). |
| Sample Size | Typically small, focusing on in-depth understanding. | Often large, aiming for statistical significance. |
| Questions Asked | "Why?" "How?" "What are people's experiences with...?" | "How many?" "How much?" "How often?" |
In the end, the choice between them comes down to your research goals.
If you want to know how many customers abandoned their shopping carts, you’d turn to quantitative analysis. But if you want to know why they felt frustrated and gave up, that’s a job for qualitative analysis.
The 5 Lenses of Qualitative Analysis
Once you’ve gathered all your rich, qualitative data, the real work begins. How do you turn hours of interviews or pages of feedback into clear, actionable insights? There’s no single right way; instead, there are several distinct methods for analyzing qualitative data.
Think of these methods as different lenses. Each one brings a unique aspect of your data into focus, revealing a different layer of the story. The lens you choose depends entirely on what you want to learn. Are you hunting for common patterns in customer feedback? Or are you trying to piece together one person's life journey?
Let’s look at 5 of the most common approaches to help you find the right fit for your research.
1. Thematic Analysis
If you're new to qualitative analysis, thematic analysis is the perfect place to start. It's flexible, straightforward, and probably the most common method out there. The entire goal is to sift through your data to find recurring patterns or ideas, which we call themes.
Imagine a product manager digging through 500 open-ended survey responses about a new app. By grouping the comments, she might identify themes like "confusing navigation," "slow loading times," and "helpful customer support." These themes don't just organize the data; they create a clear roadmap for what the development team needs to tackle next.
2. Content Analysis
Content analysis is a close cousin to thematic analysis, but it often brings numbers into the mix. Where thematic analysis looks for broader ideas, content analysis is more focused on counting and categorizing specific words, phrases, or concepts. It systematically tracks how often something appears.
For example, a marketing team could use content analysis to track their brand's reputation on social media. They might analyze a month's worth of tweets to count how many times words like "expensive," "reliable," or "innovative" show up. This gives them a quantitative snapshot of public perception, blending qualitative context with hard numbers.
3. Narrative Analysis
People make sense of their lives through stories. Narrative analysis is all about honoring that. Instead of breaking interviews into tiny pieces, this method looks at the whole story—the plot, characters, setting, and sequence of events—to understand an individual's unique perspective.
Key Insight: Narrative analysis treats a person's story as a whole, preserving the context and emotion that often get lost in other methods. It’s about understanding the world through someone else’s eyes, one story at a time.
A great use case would be a researcher interviewing a small business owner about her journey. Using narrative analysis, the researcher can construct a powerful chronological story that highlights key challenges, turning points, and personal motivations. This creates a deeply human case study that resonates far more than a simple list of facts.
4. Grounded Theory
Grounded theory is a bit different from the others. Instead of starting with a hypothesis you want to test, you build a brand-new theory directly from the data itself. It’s an intensive, cyclical process where you constantly compare your data, the codes you create, and the concepts that start to emerge.
The goal here is to generate a theory that is "grounded" in the real-world data you've collected. For instance, a sociologist studying a new online community could use grounded theory to develop a novel explanation for how strangers build trust in digital spaces. You can learn more by exploring different qualitative research analysis methods in our other guides.
5. Discourse Analysis
Words are more than just words; they carry power. Discourse analysis focuses on language in its social and political context. It moves beyond what is said to explore how it's said, examining how language shapes our beliefs, relationships, and society as a whole.
This method is perfect for understanding underlying power dynamics. A political scientist, for example, might use discourse analysis to study politicians' speeches on immigration. They wouldn't just log the topics but analyze how specific words and framing techniques are used to influence public opinion and shape policy debates.
Your Step-By-Step Guide to Analyzing Qualitative Data
Knowing the different qualitative methods is one thing; putting them into practice is another. The journey from raw data—like hours of interview recordings or piles of field notes—to actual, clear-cut findings follows a surprisingly structured path. Think of it less like a rigid set of rules and more like a flexible framework that helps you make sense of all that rich, complex information.
Let's walk through a practical, five-step process. To keep things grounded, we'll follow a UX researcher at a software company who needs to analyze feedback from user testing sessions for a new mobile app feature.
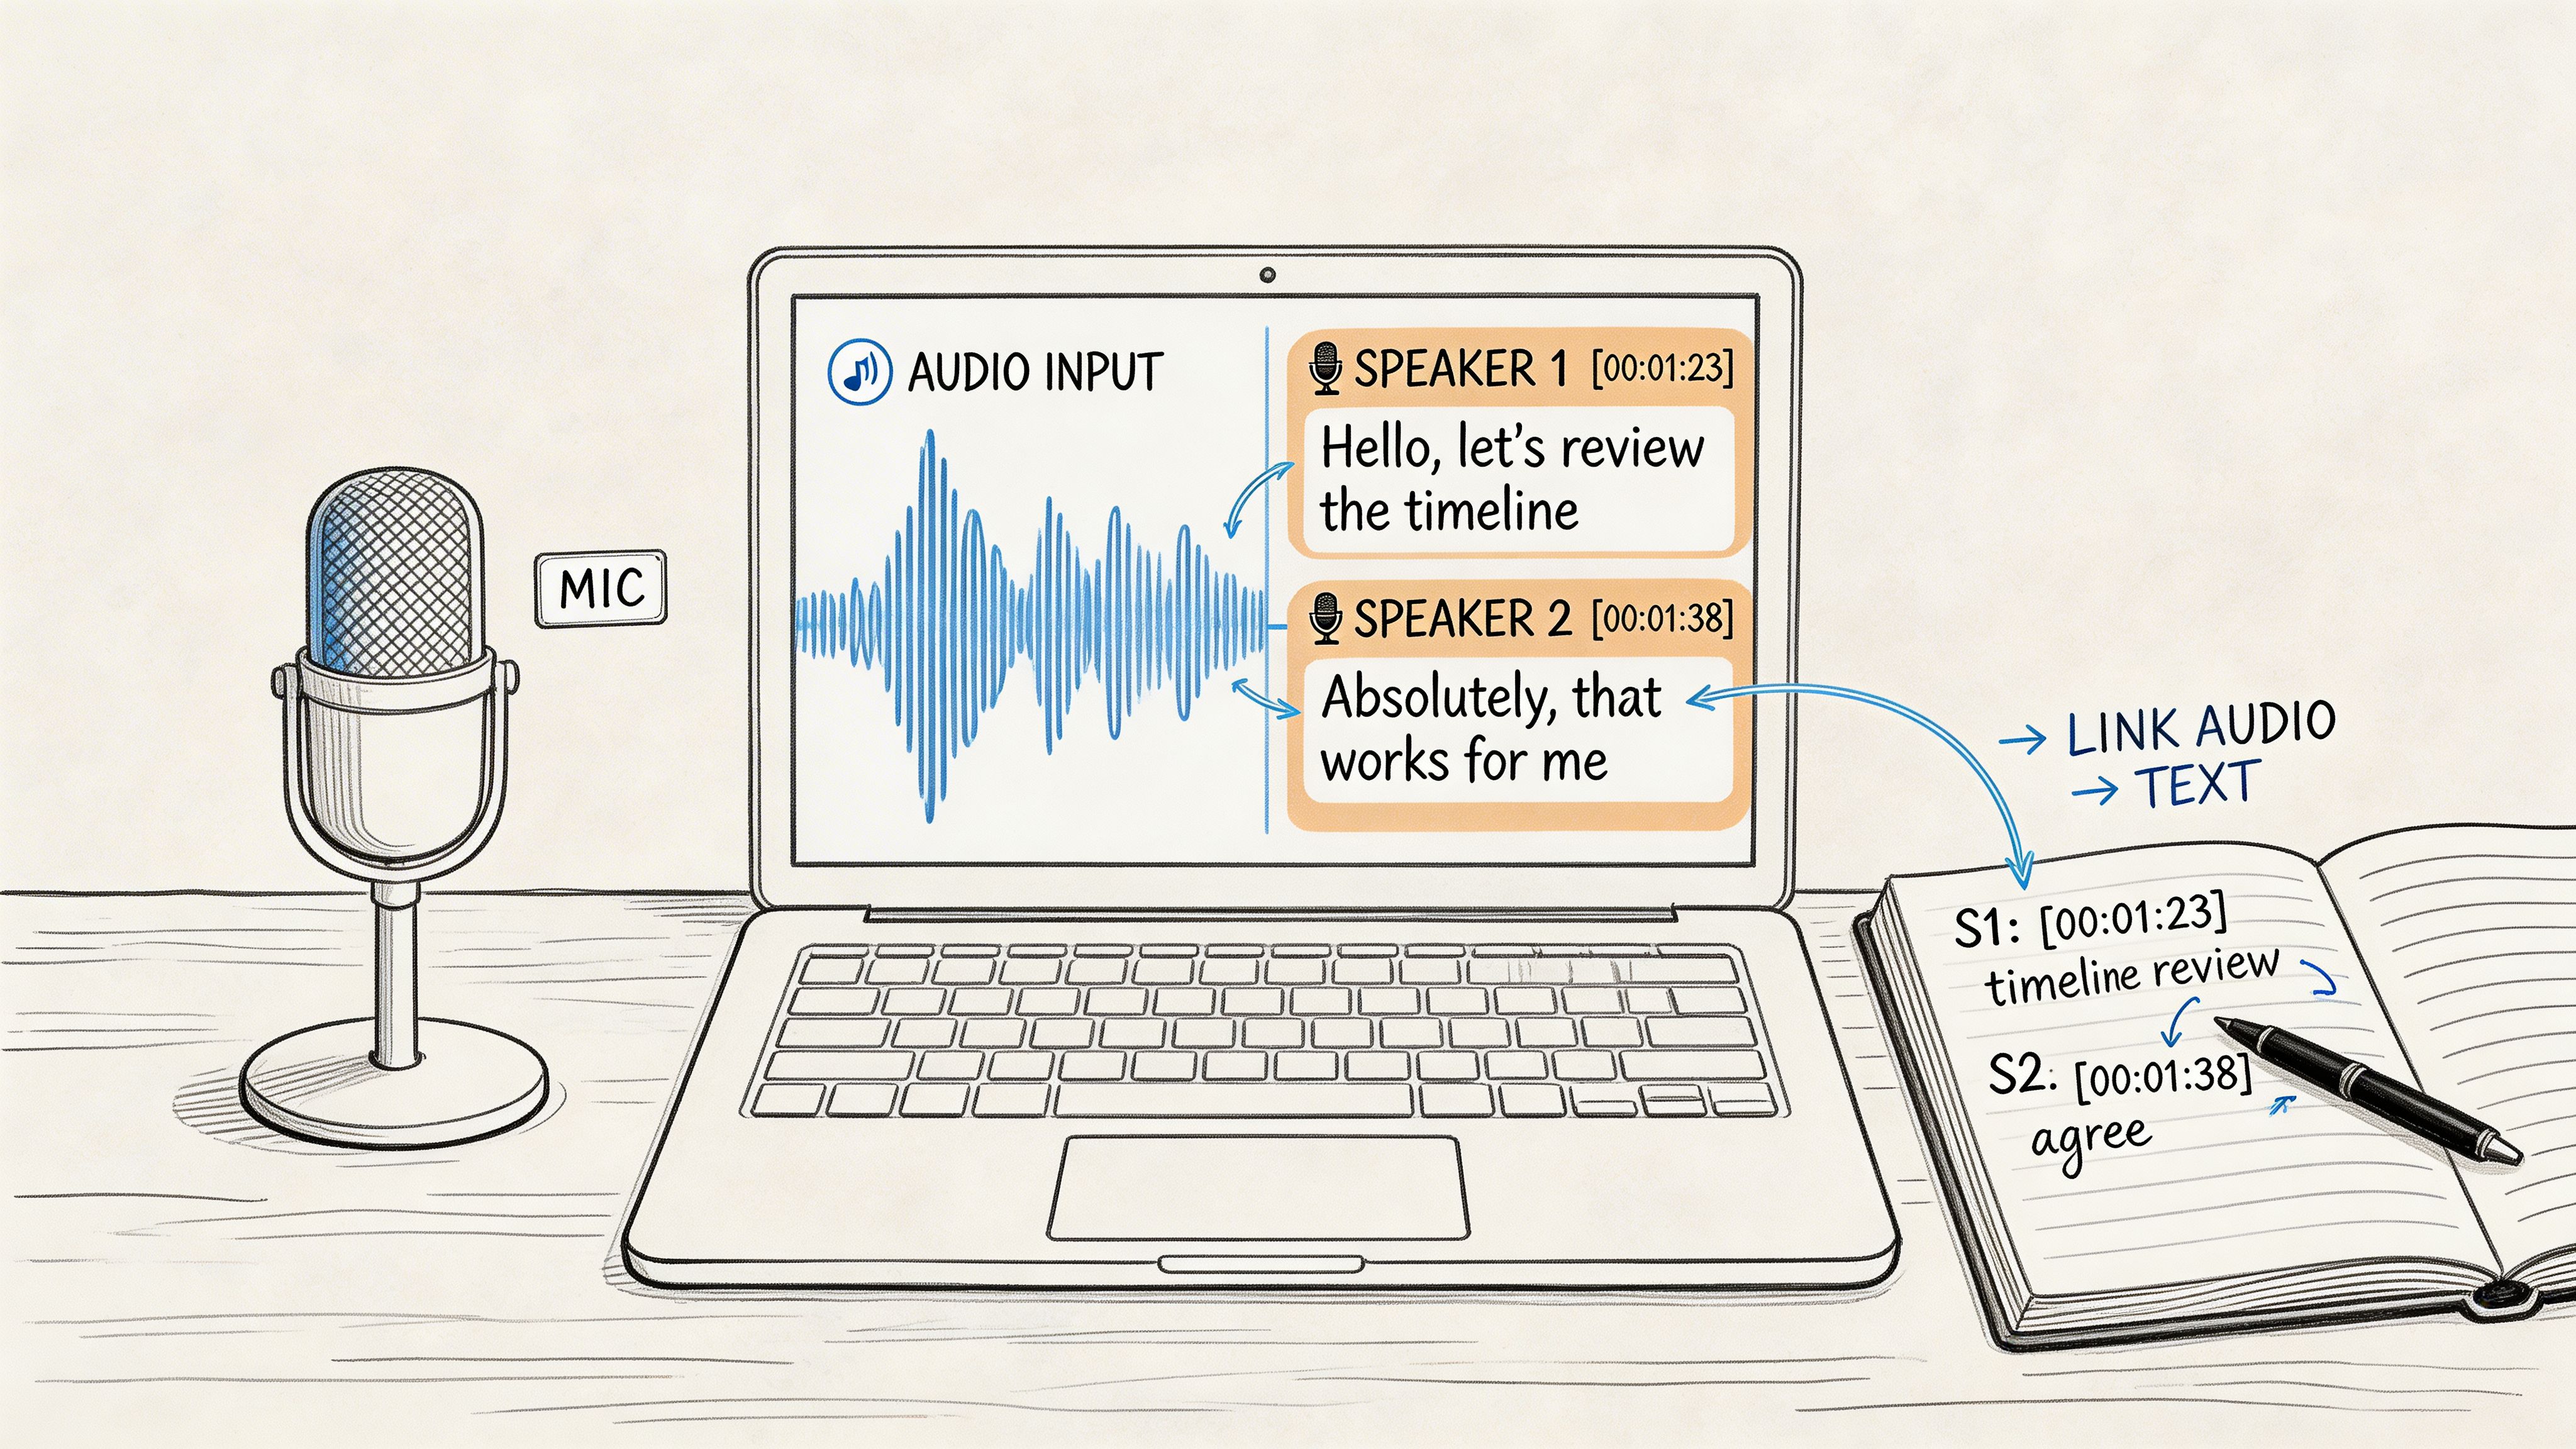
Step 1: Data Collection and Preparation
Before any real analysis can begin, you need clean, organized data. This first stage is all about gathering your materials and shaping them into a workable format. For our UX researcher, that means collecting the video recordings from her user tests and organizing any notes she jotted down during the sessions.
The single most critical task here is transcription—turning all that spoken audio into written text. This is, without a doubt, often the most time-consuming part of the whole project. Manually transcribing just one hour of audio can easily take four to five hours of dedicated work. For a deeper dive into this crucial step, check out our complete guide to qualitative research transcription.
Step 2: Initial Exploration
Once your transcripts are ready, fight the temptation to jump straight into labeling and categorizing. The first real step in analysis is much simpler: just read everything. This initial pass is about immersing yourself in the data, getting a feel for the landscape before you start mapping it out.
Our researcher reads through all her transcripts and notes, making casual annotations in the margins. She isn't applying formal codes just yet. Instead, she's highlighting interesting quotes, noting recurring complaints, and just getting a gut feeling for the users' overall sentiment. This step builds a mental map of the data that will guide her later.
Key Insight: This exploratory phase is like watching the whole movie before you start analyzing individual scenes. It provides essential context that prevents you from getting lost in the details later on.
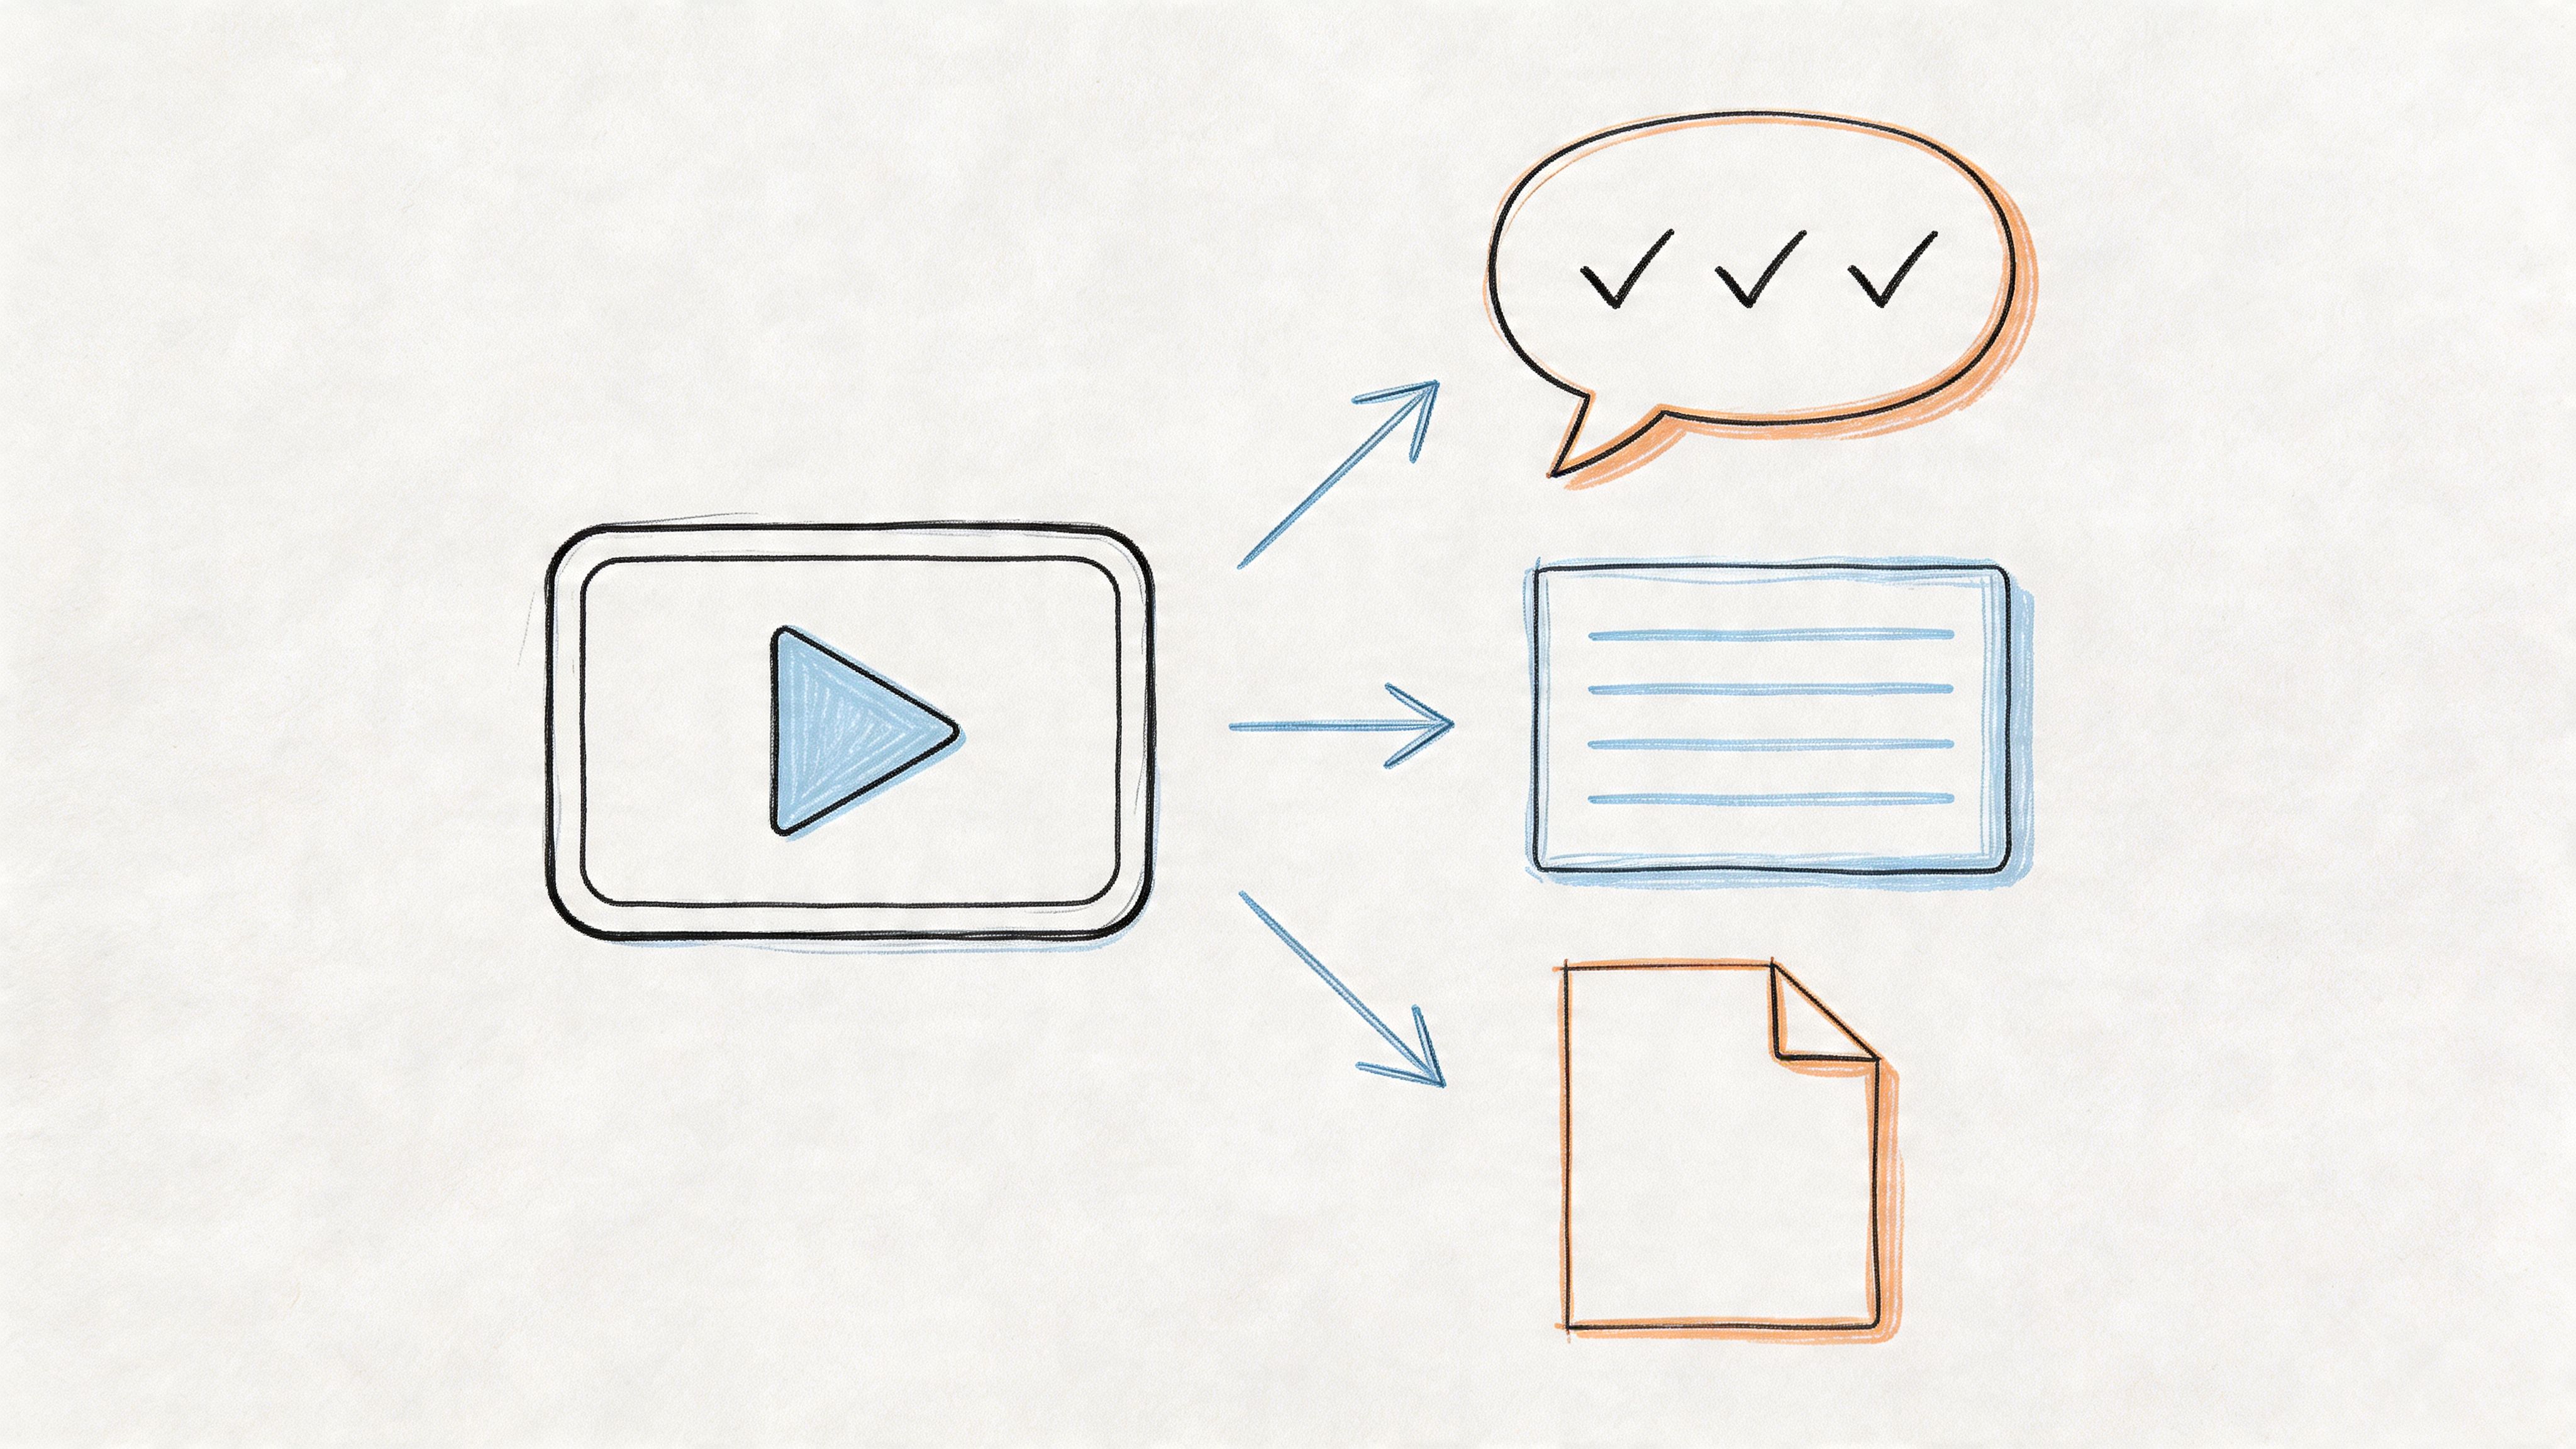
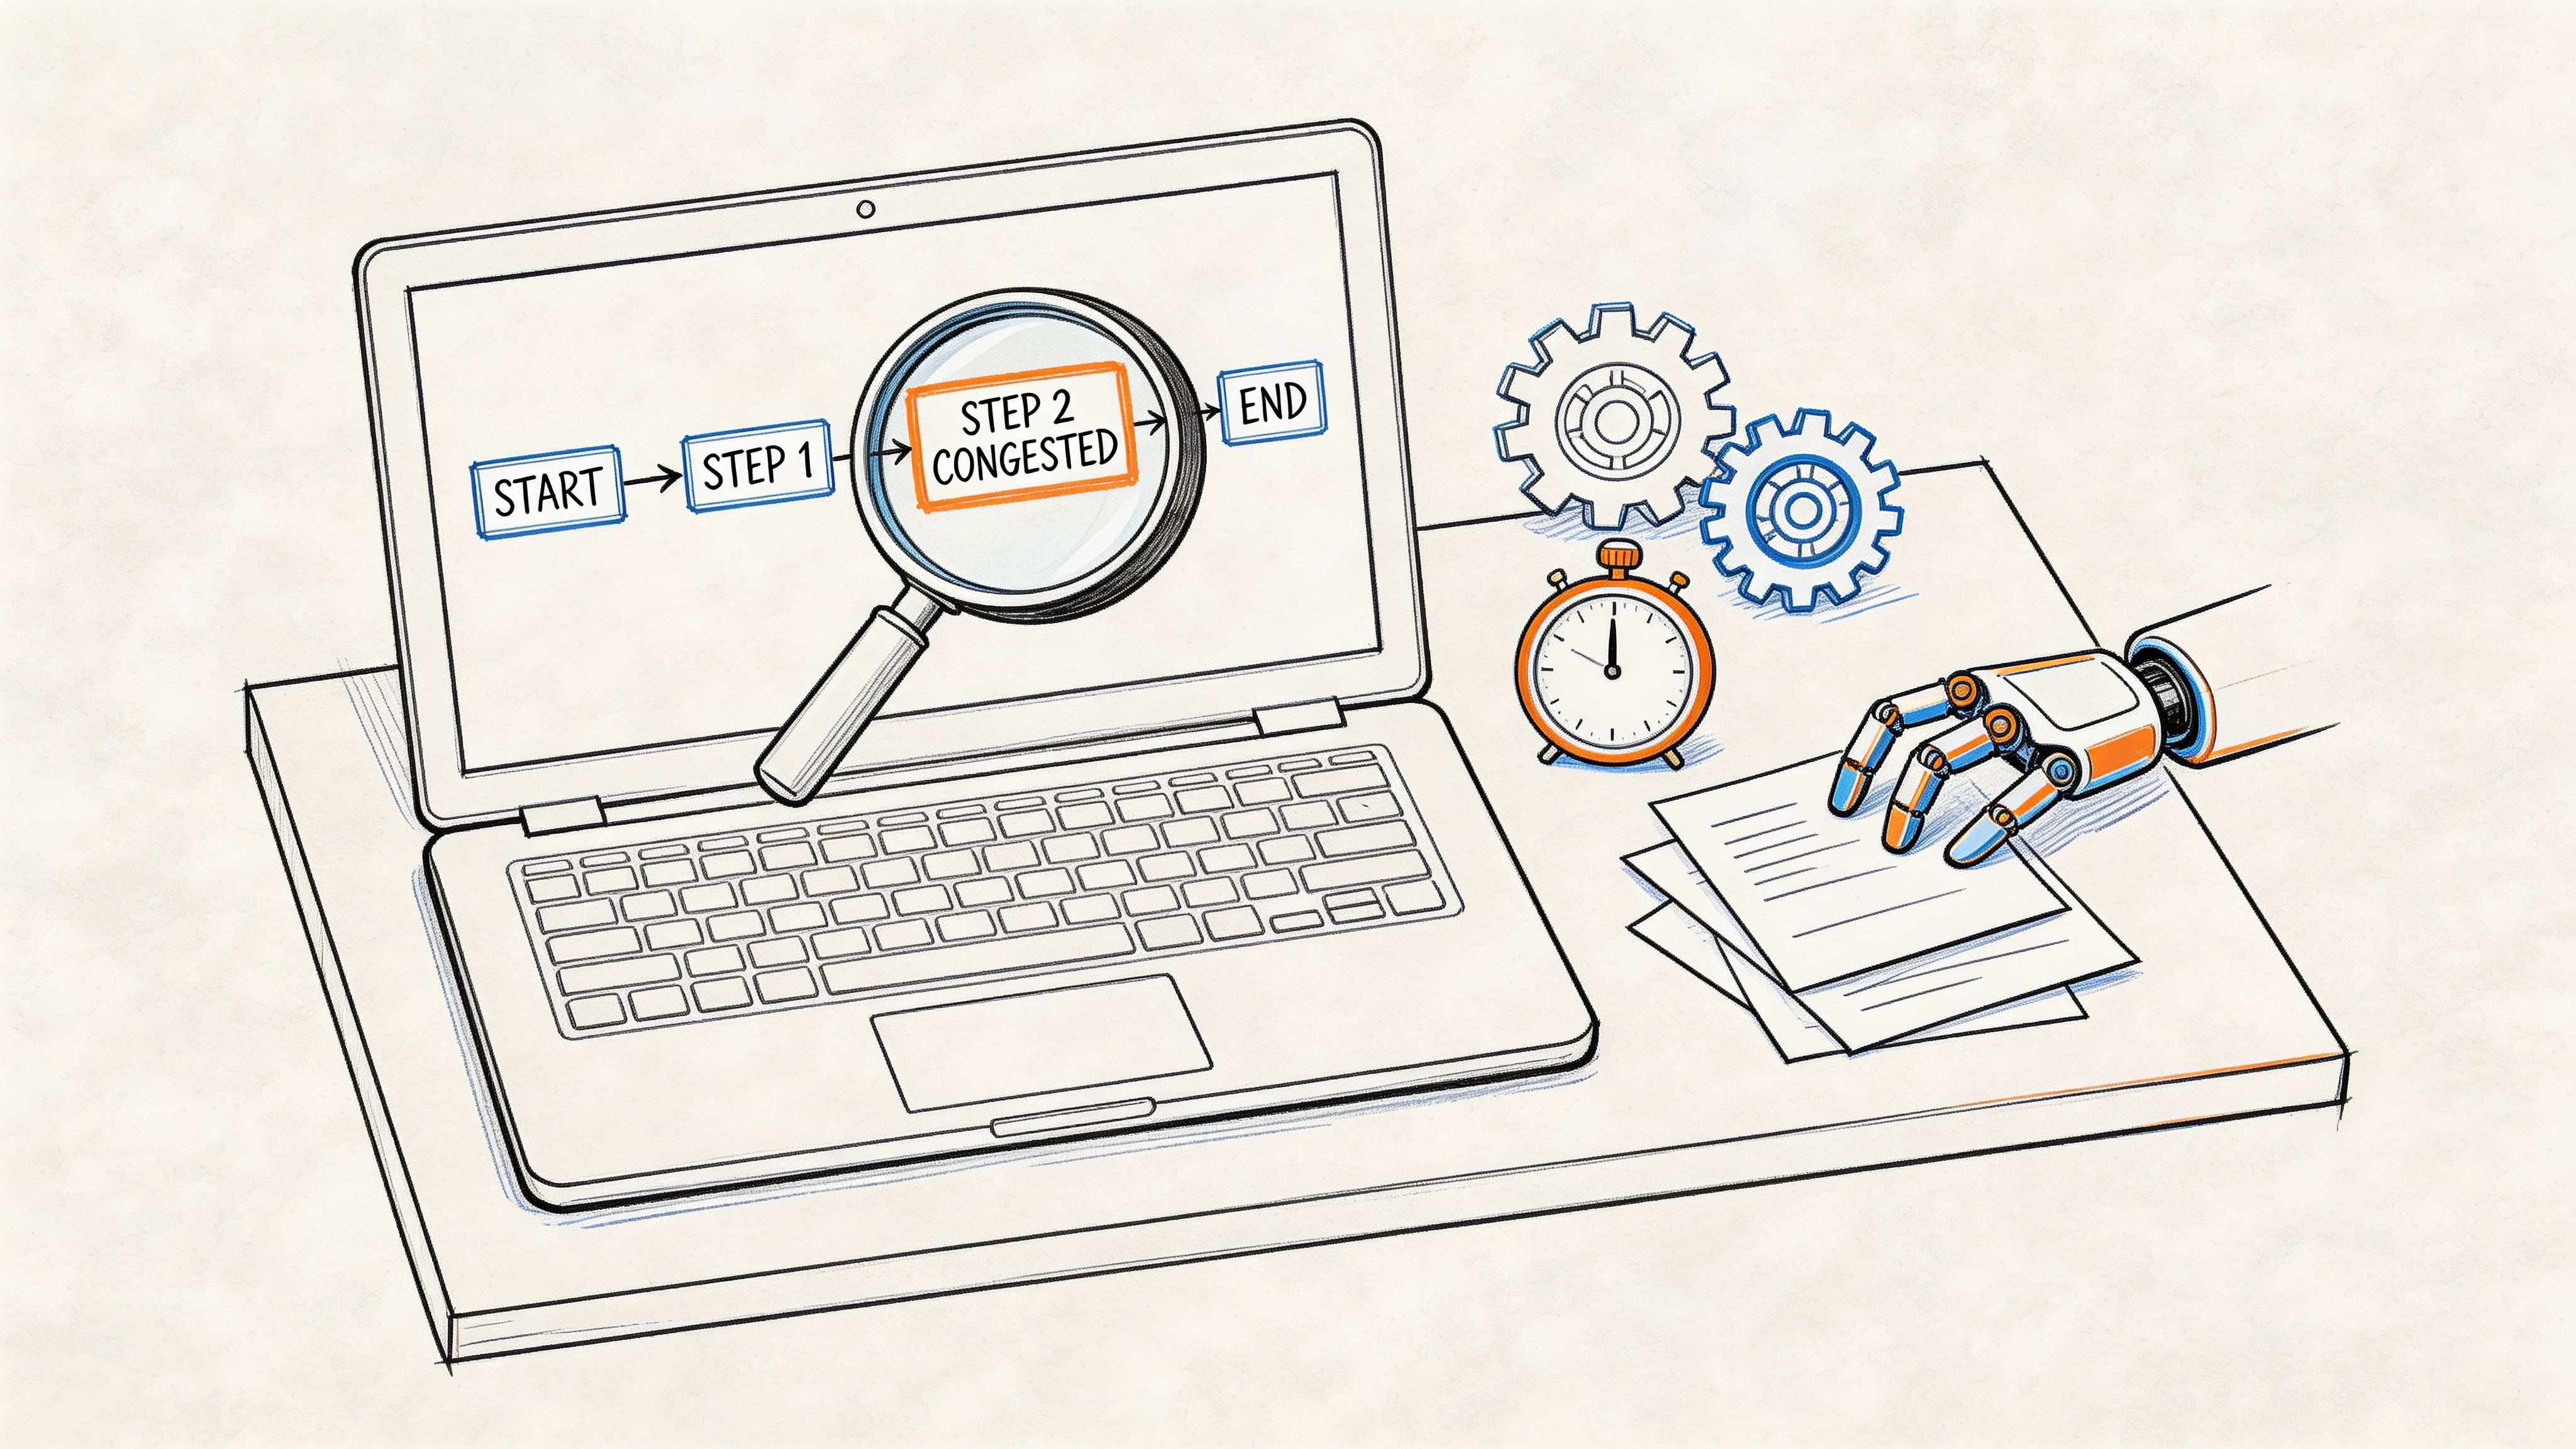
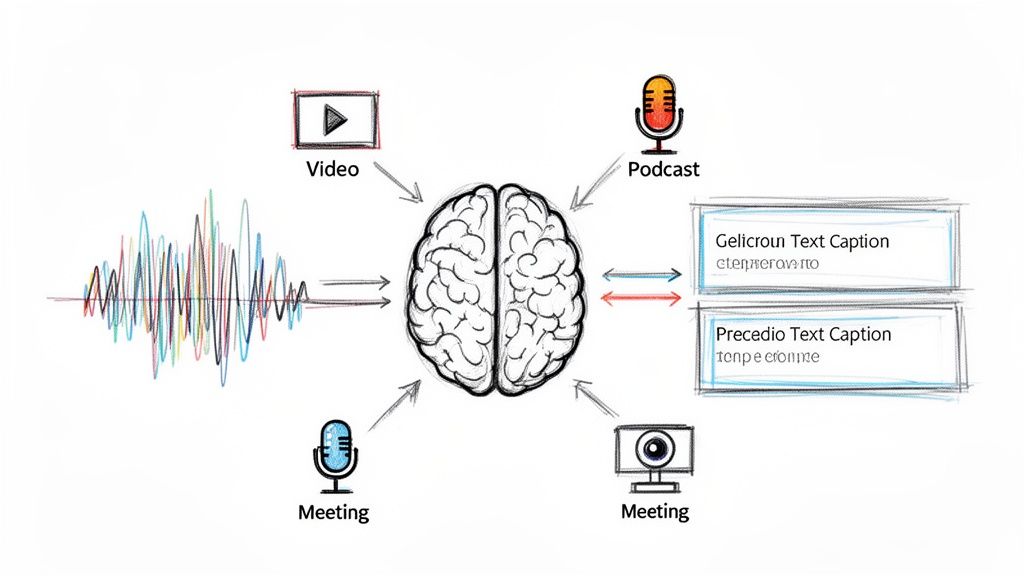
The flowchart below shows how different analysis methods fit into the overall process.
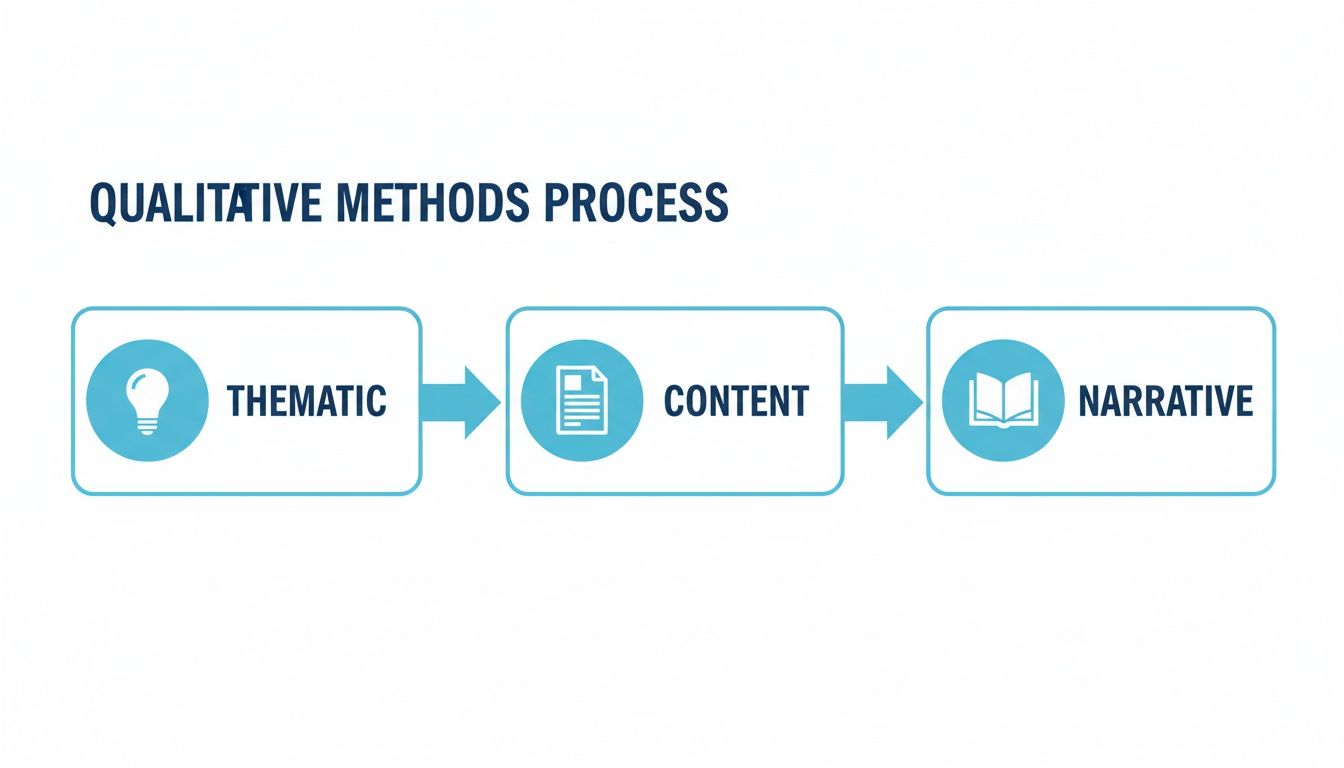
As you can see, different paths like thematic or narrative analysis help you achieve distinct goals, from finding broad patterns to understanding individual stories.
Step 3: Coding the Data
Now the real deep-dive begins. Coding is the process of attaching short labels, or "codes," to specific segments of your text to identify important concepts. It’s like creating a detailed, searchable index for all your qualitative data.
Our UX researcher gets to work, highlighting specific phrases in her transcripts and assigning codes.
- A user says, "I couldn't find the save button anywhere." She codes this as "navigation issue."
- Another user comments, "Wow, the onboarding tutorial was super helpful." This gets coded as "positive onboarding."
- A third mentions, "The app crashed when I tried to upload a photo." This is coded as "technical bug."
She continues this process meticulously, creating dozens of codes that capture the specific, granular feedback from each user.
Step 4: Developing Themes
With all the data coded, it's time to zoom out and look for the bigger picture. In this stage, you start grouping your individual codes into broader, more meaningful themes. These themes are the core stories and patterns that are emerging from your data.
Looking over her long list of codes, our researcher starts to spot clear patterns:
- The codes "navigation issue," "confusing icons," and "hidden menu" all point to the same larger problem. She groups them under a new theme: "Poor User Interface Discoverability."
- Similarly, the codes "positive onboarding," "helpful tooltips," and "clear instructions" are bundled together into the theme: "Effective User Guidance."
These themes begin to tell a powerful story about the app's biggest strengths and weaknesses.
Step 5: Interpretation and Reporting
The final step is to connect your findings back to your original research questions and share them with others. This involves interpreting what your themes actually mean and presenting them in a clear, compelling report. The sheer volume of text at this stage can be daunting. A 2004 study found that a single focus group transcript can generate 20-40 pages of text, and large projects can easily exceed 2,000 pages, creating a massive analytical task. You can read more about the challenges of handling large qualitative datasets in this detailed study.
Our researcher writes a summary report for her team. She uses the themes as major headings, pulling in powerful quotes from users to bring each point to life. Her final report doesn't just present data; it delivers a clear, evidence-based list of actionable insights: fix the confusing navigation, but absolutely keep the excellent onboarding process.
This entire workflow helps turn messy, unstructured data into a clear, strategic asset. The table below summarizes the process for a quick overview.
Qualitative Data Analysis Workflow
| Step | Key Action | Primary Goal |
|---|---|---|
| 1. Preparation | Gather, clean, and transcribe all raw data (interviews, notes). | Create a complete and accurate text-based dataset ready for analysis. |
| 2. Exploration | Read through all transcripts to get a holistic sense of the data. | Understand the overall context and identify initial impressions without bias. |
| 3. Coding | Assign short labels (codes) to specific segments of text. | Systematically categorize and organize all relevant data points. |
| 4. Theme Development | Group related codes together to identify overarching patterns. | Synthesize codes into higher-level concepts that explain the data. |
| 5. Reporting | Interpret themes, connect to research questions, and present findings. | Communicate actionable insights supported by evidence from the data. |
By following these steps, you can systematically move from hundreds of pages of text to the handful of key insights that truly matter.
How to Code Data and Uncover Powerful Themes
So, you’ve collected all your interview transcripts, survey responses, and user notes. Now what? You’re staring at a mountain of raw text, and the real work is about to begin. This is where coding comes in—it’s the foundational step that turns all that messy, unstructured data into organized, meaningful insights.
Think of coding as creating a detailed index for your data. You’re essentially tagging snippets of text with short, descriptive labels. By doing this, you’re not just reading; you’re systematically breaking down the information so you can find every mention of a specific idea later on. It’s how you transform hundreds of pages of notes into a solid foundation for analysis.
From Codes to Actionable Themes
Coding is just the first step. The real payoff comes when you start seeing patterns and grouping those individual codes into larger, more significant themes. Themes are the big-picture stories that your data is trying to tell you. A single code is just one data point, but a theme is the narrative that connects them all.
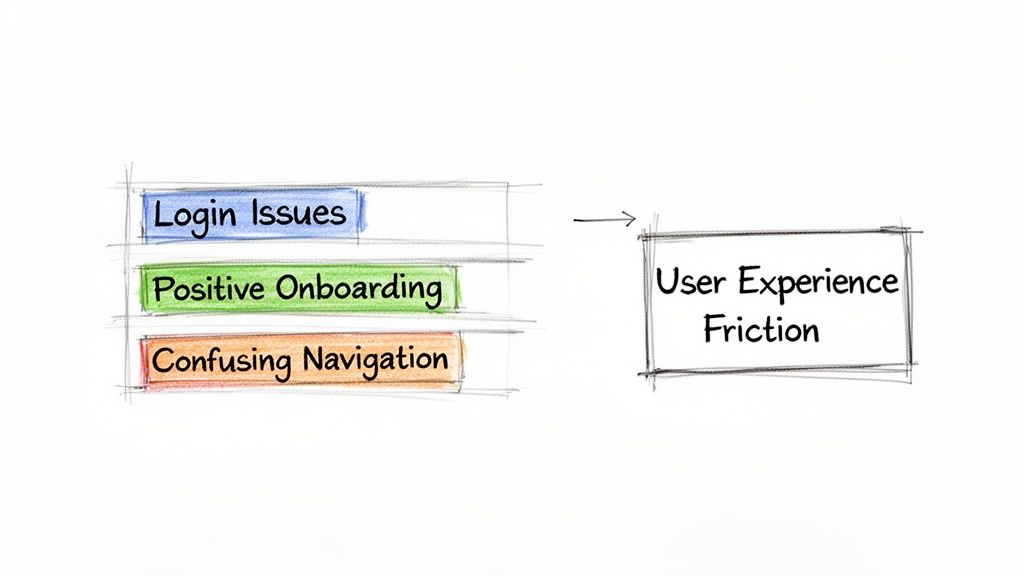
Let’s imagine you’re analyzing feedback on a new software feature and come across this quote from a user:
"I was so excited to try the new reporting tool, but I couldn't figure out where to find it. The main menu is already so cluttered, and after five minutes of clicking around, I just gave up."
Here’s how you’d turn that feedback into insight:
First, you apply specific codes. You’d probably tag the phrase "couldn't figure out where to find it" with a code like
Navigation Difficulty. The comment about the "main menu is already so cluttered" gets a code likeUI Clutter. And that final, powerful statement, "I just gave up," could be coded asUser Frustration.Next, you group codes into a theme. As you go through more interviews, you’ll likely see the codes
Navigation DifficultyandUI Clutterpopping up again and again. These individual problems point to a much bigger issue, which you can bundle under the theme User Experience Friction. This theme is what you can take to the design team—it’s a clear, actionable insight that’s far more powerful than a list of isolated complaints. If you want to dive deeper, we have a whole guide on how to analyze qualitative interview data.
This journey from tiny, granular codes to high-level strategic themes is really where the a-ha moments happen.
Two Paths to Coding Your Data
When it comes to the actual process of coding, researchers typically take one of two routes. The best one for you really just depends on what you're trying to accomplish.
Deductive Coding: This is a "top-down" method. You start with a list of pre-determined codes based on your research questions or an existing theory. This approach is perfect when you’re trying to confirm or disprove a hypothesis.
Inductive Coding: This is the "bottom-up" route. You go into the data with a completely open mind, creating new codes as you discover new ideas. It’s ideal for exploratory research where you don’t know what you might find.
Key Takeaway: Coding isn't just a mechanical task of organizing text. It's an interpretive process that forces you to think deeply about what your participants are really saying. It's how you move beyond surface-level comments to find the powerful themes that drive meaningful change.
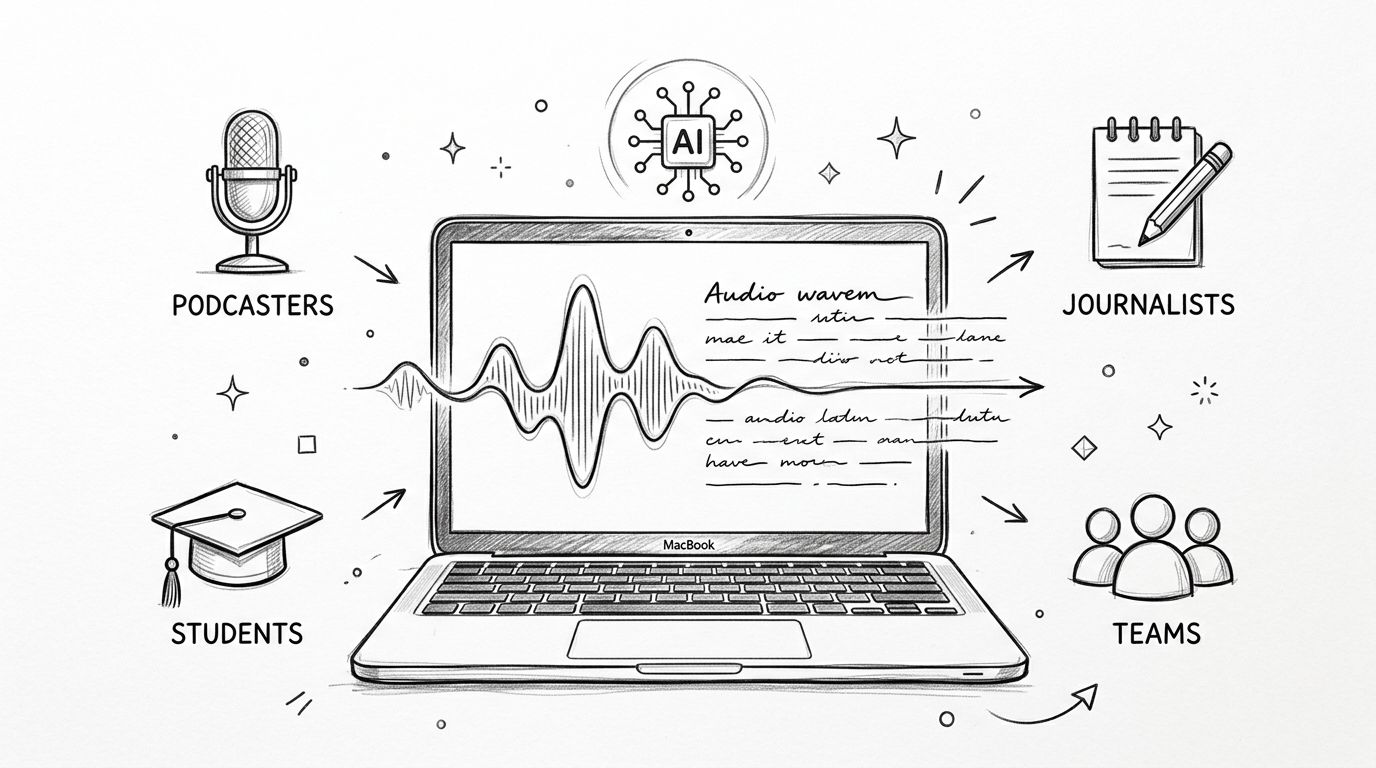
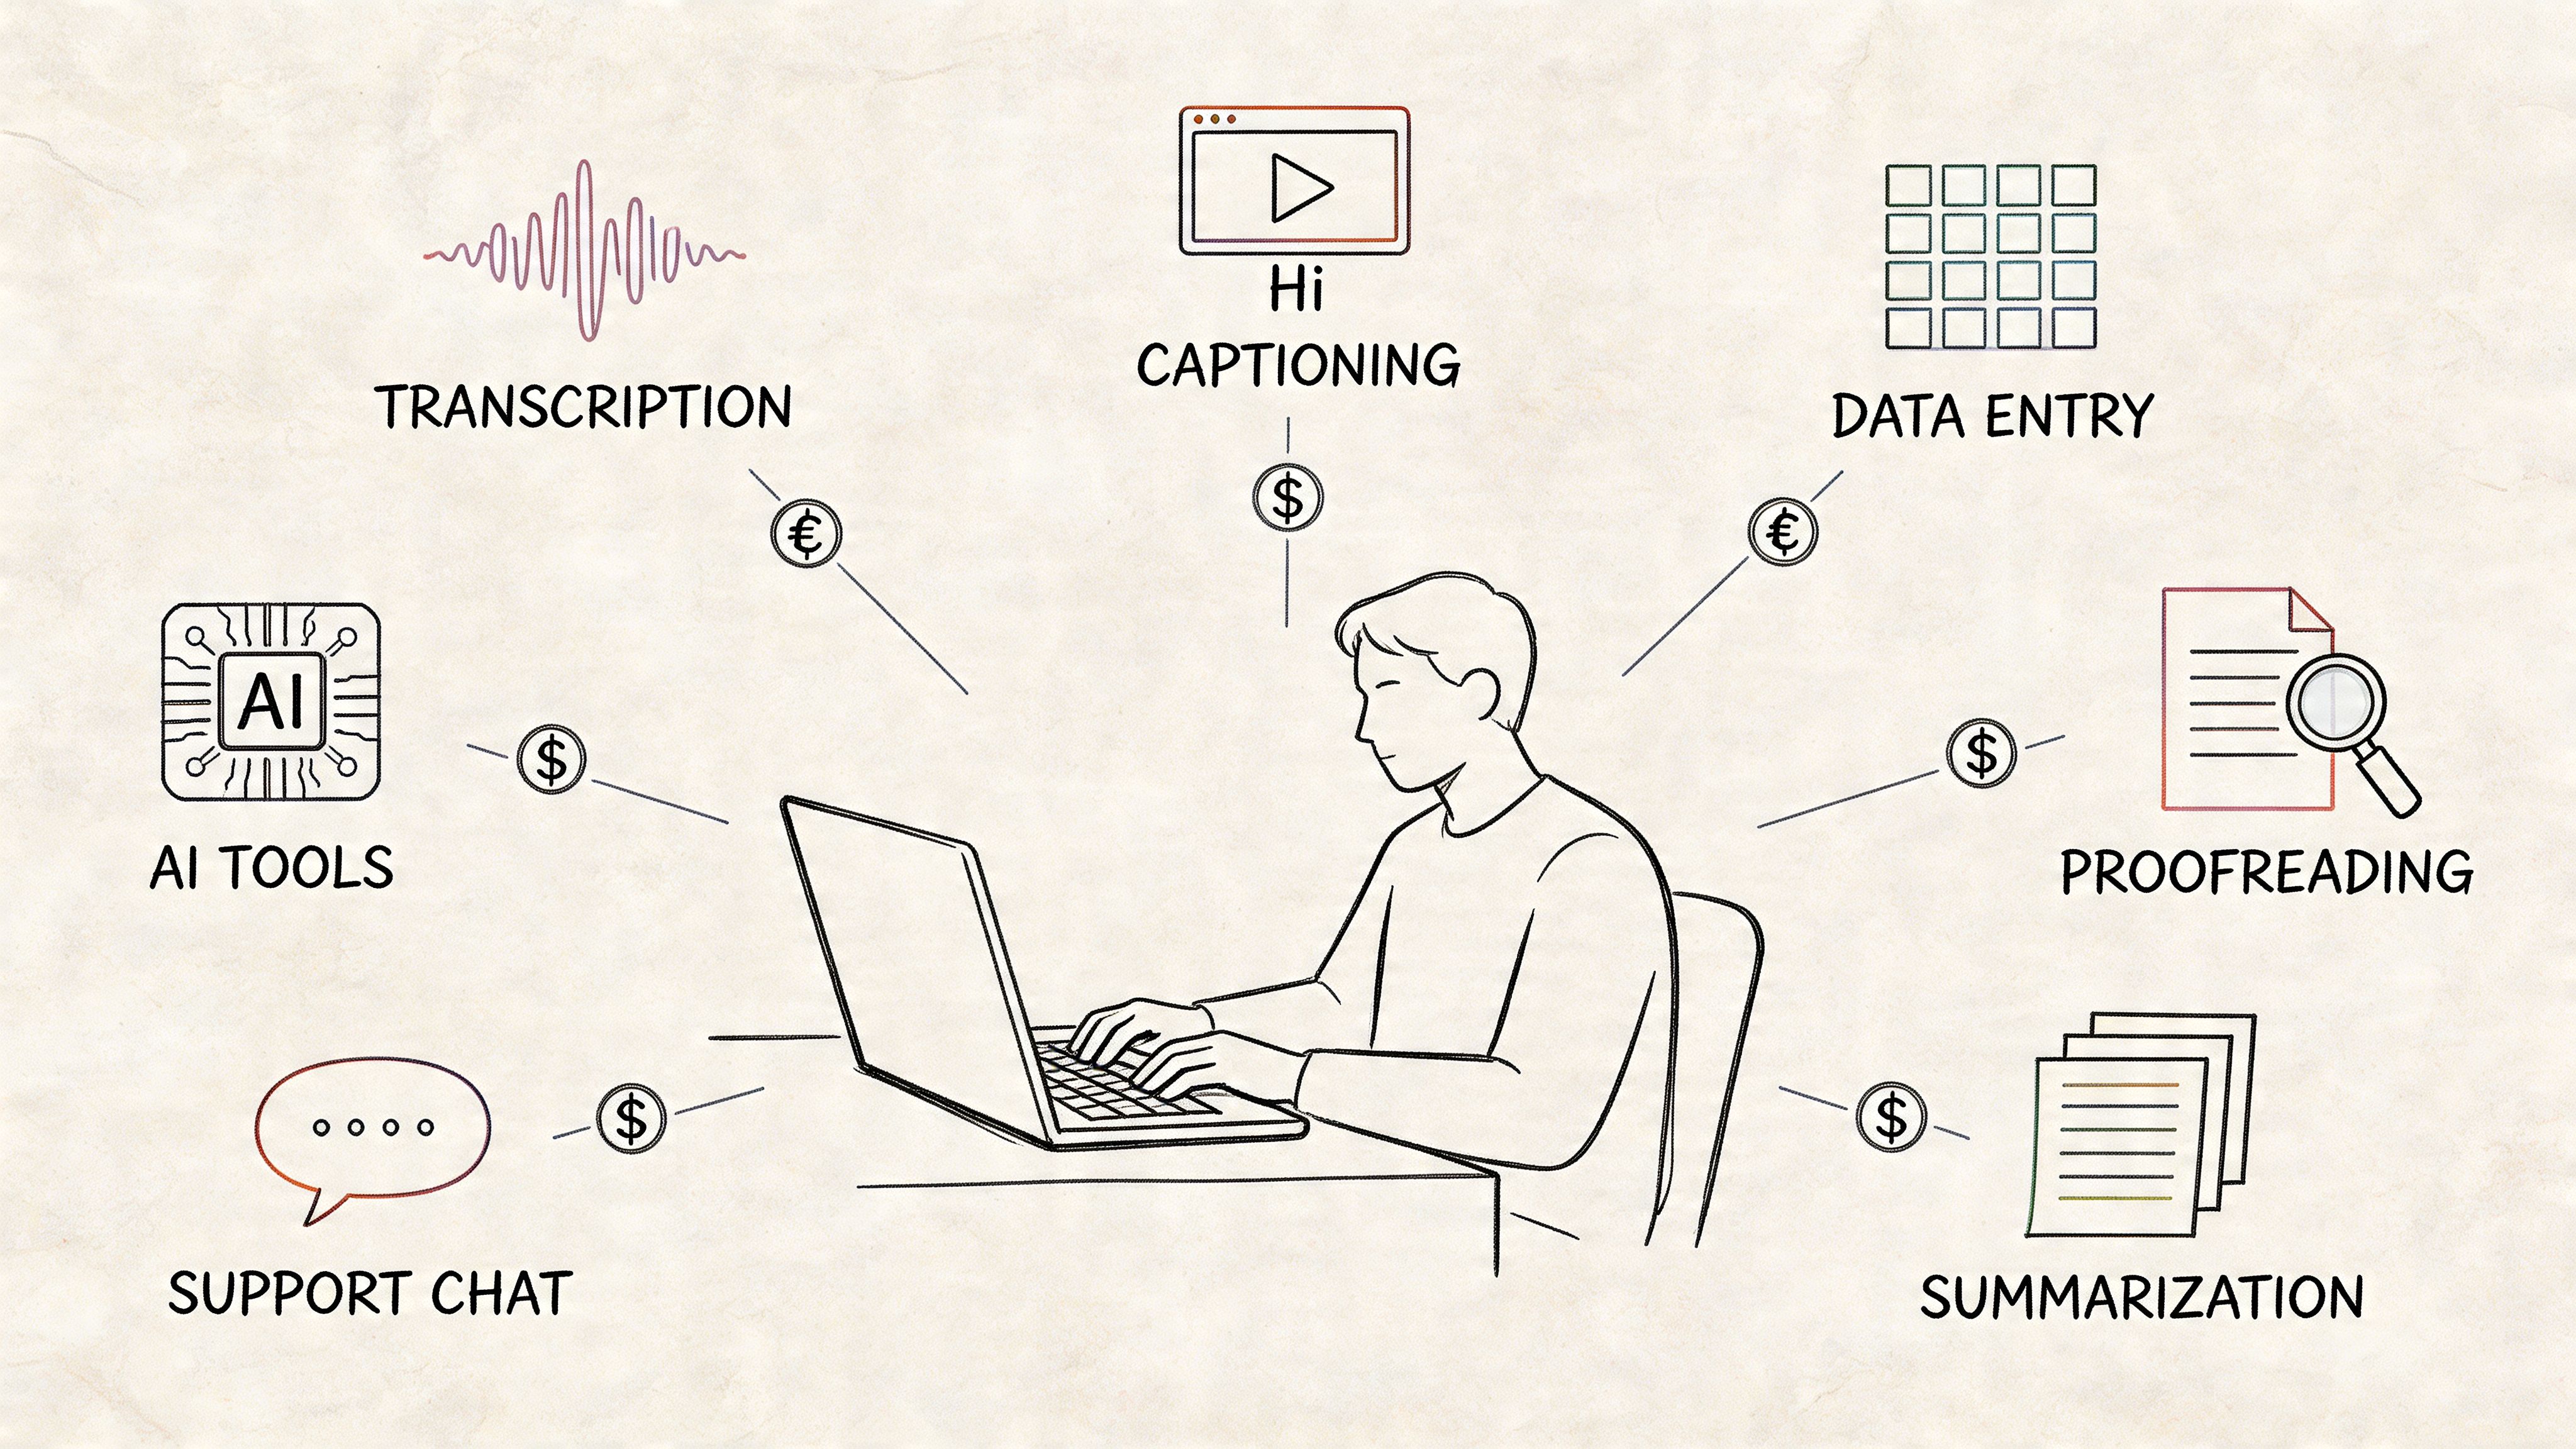
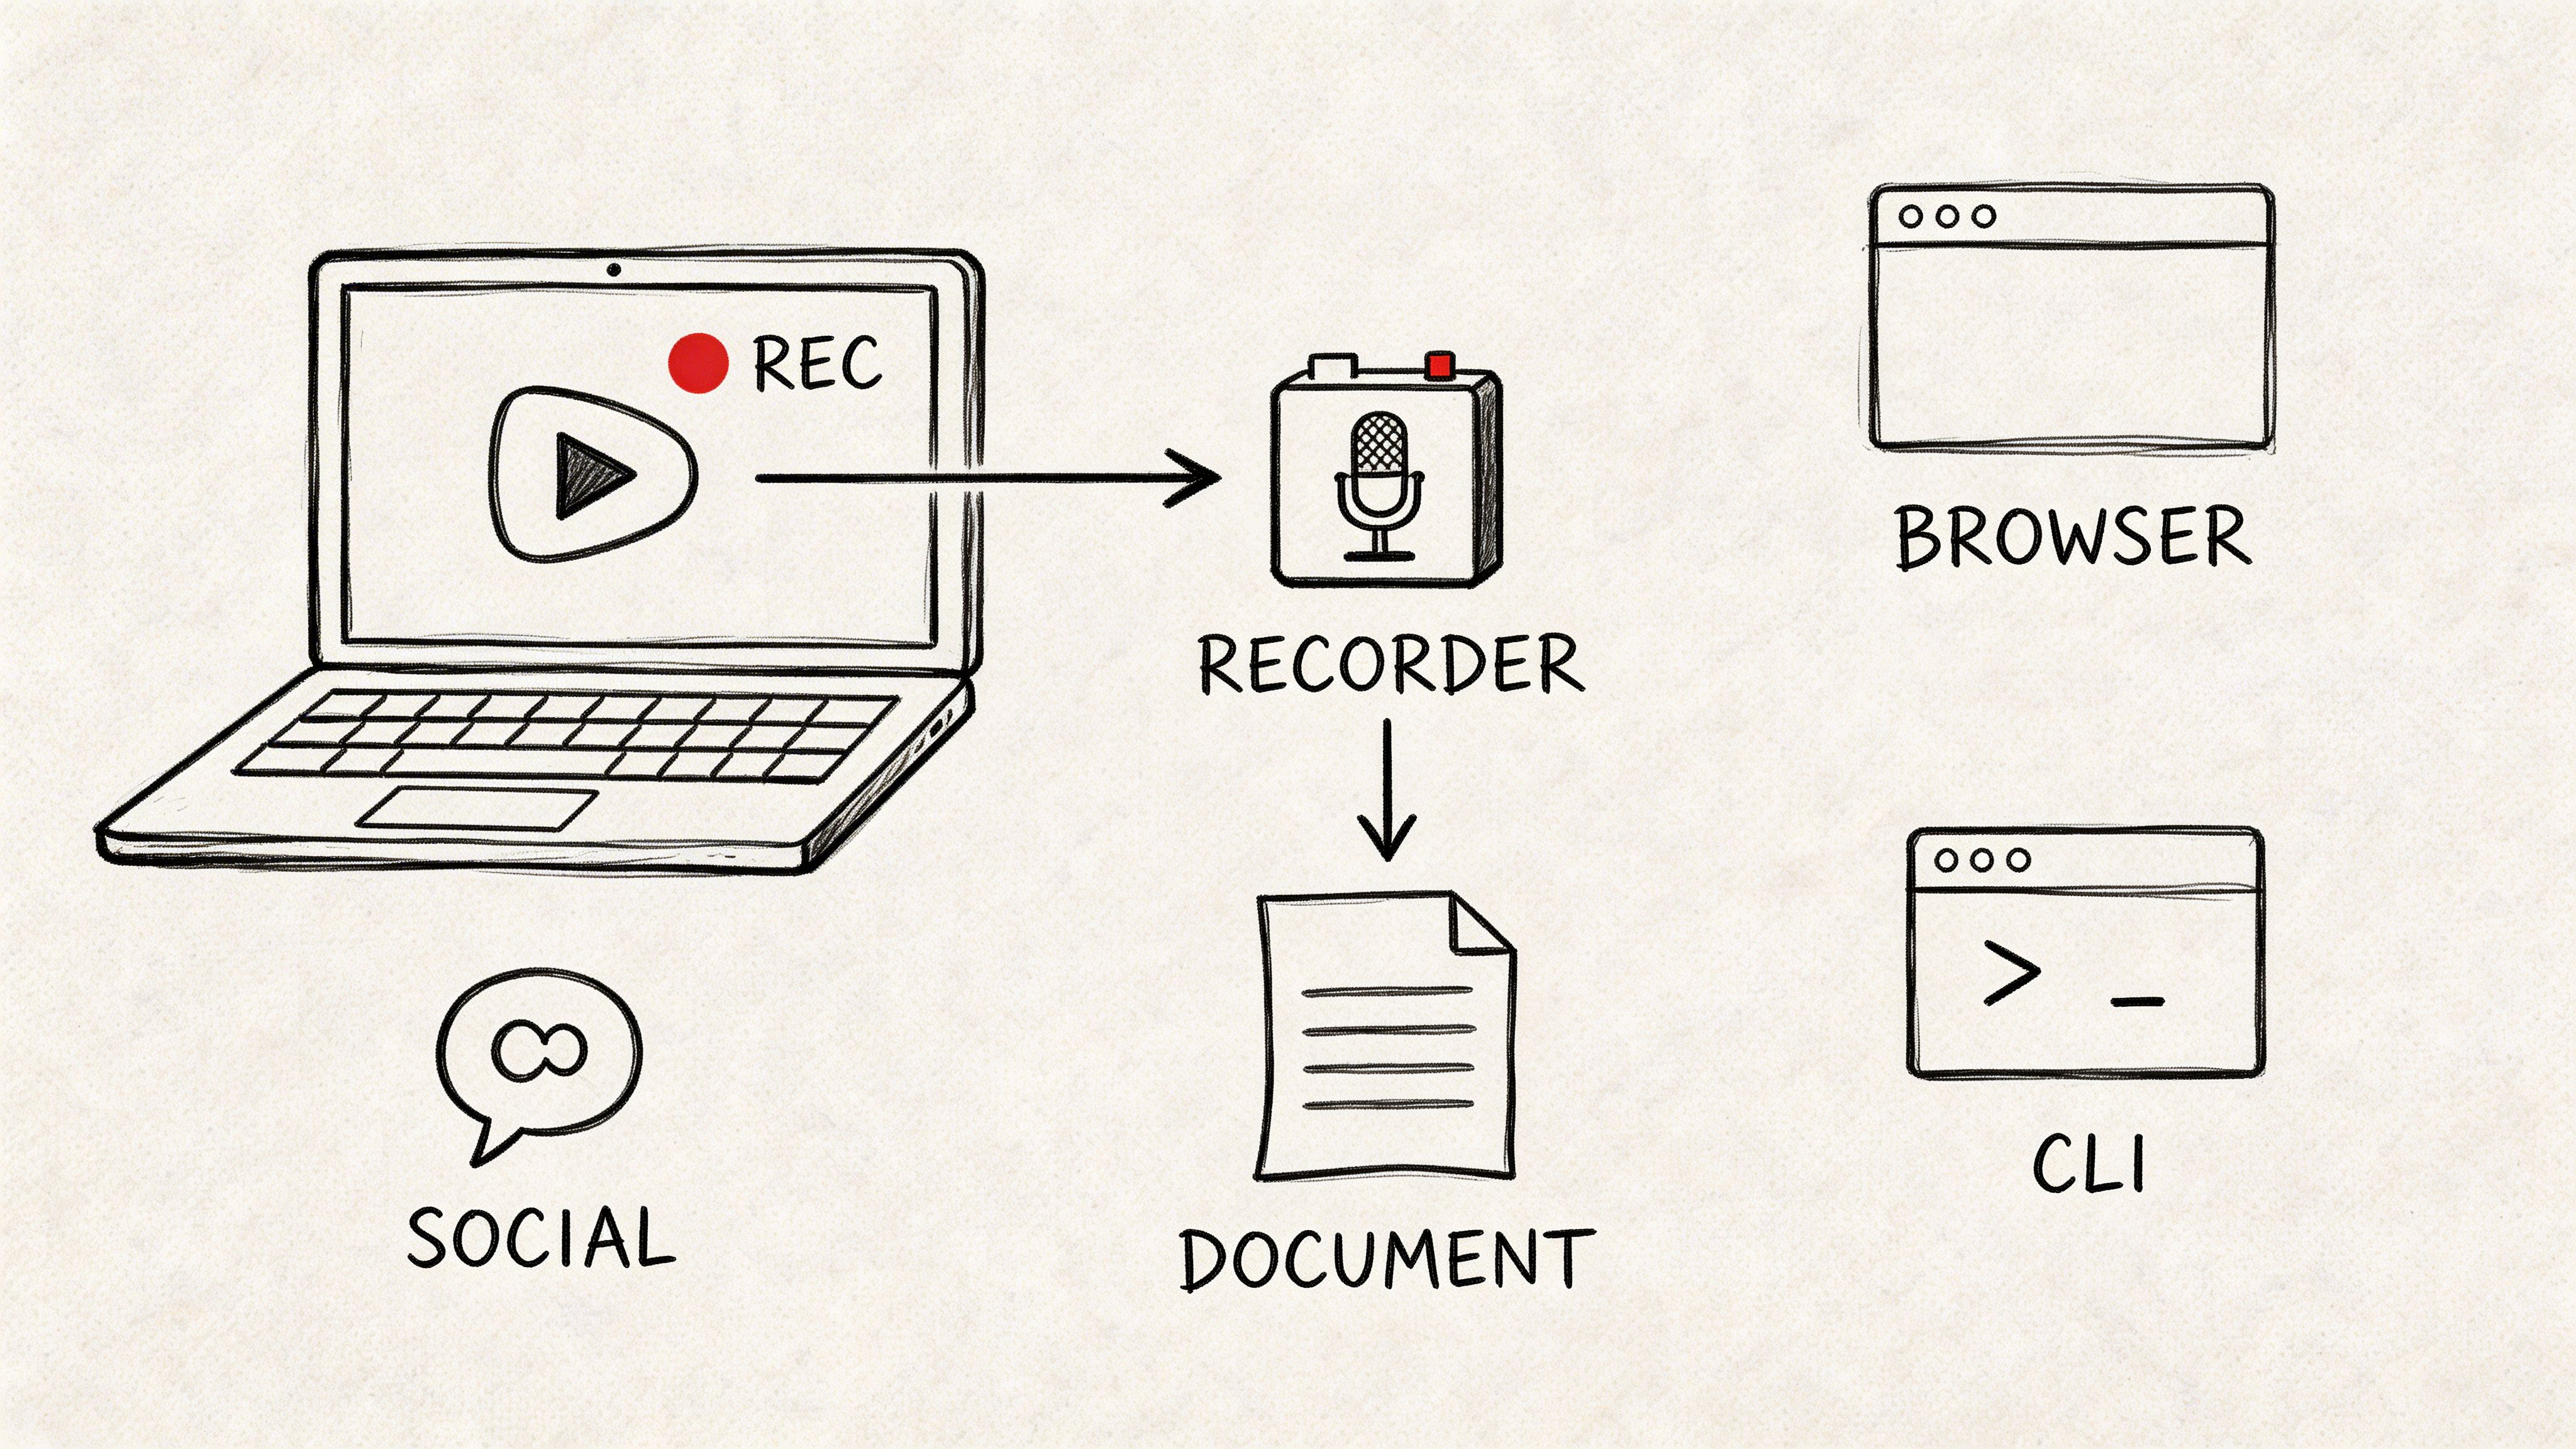
How AI Tools Accelerate Your Qualitative Analysis
Let's be honest: the single biggest roadblock in any qualitative project is the sheer amount of manual work. The hours spent transcribing interviews and then painstakingly combing through pages of text can bog down a project for weeks, if not months. This is where the right AI tools can make a massive difference.
Think of platforms like Whisper AI as your personal research assistant. The old way meant spending maybe five hours transcribing a single one-hour interview. Now, you can upload your audio or video files and get a remarkably accurate transcript, with different speakers already labeled, in just a few minutes. That time saved isn't just a minor convenience—it's a fundamental shift that lets you focus on thinking and analyzing, not just typing.
From Raw Audio to Actionable Insights
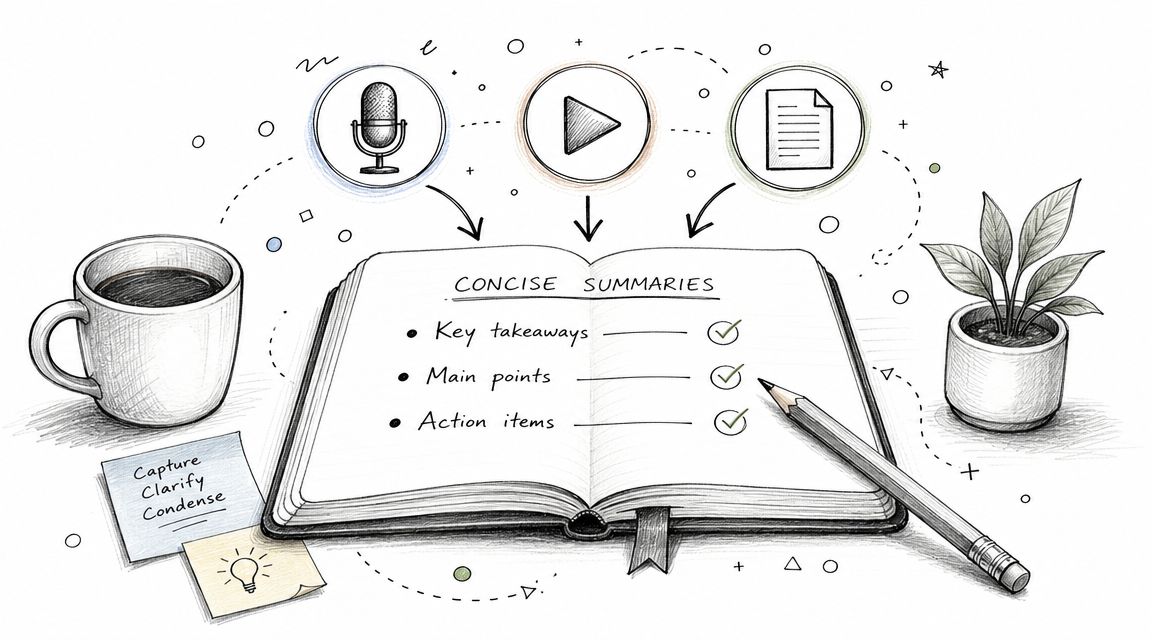
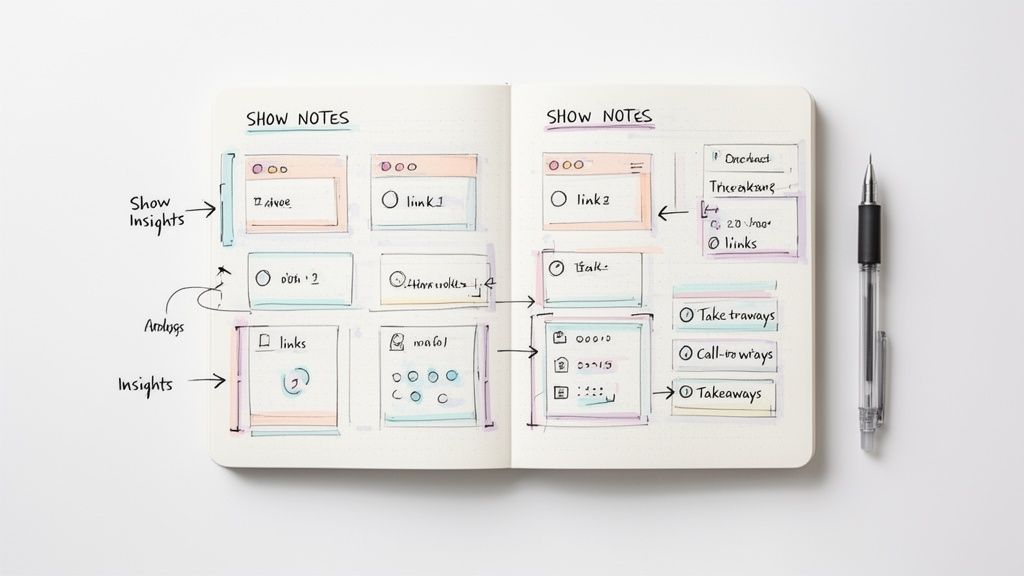
But it’s not just about getting a transcript faster. Modern tools also give you an instant high-level overview of your data. Features like automatic summarization and bullet-point highlights pull out the key themes and memorable quotes before you even start coding.
For example, this is what you see in Whisper AI right after a file is processed—a clean summary and key takeaways are generated automatically.
This first pass is incredibly valuable. It helps you spot the most interesting parts of a conversation right away, so you know exactly where to direct your attention for a deeper dive.
This completely changes the workflow. Instead of starting from scratch with a wall of text, you can feed these perfectly transcribed and summarized files into dedicated software (CAQDAS) or begin your manual coding with a huge head start. You get to spend your energy on the important stuff: connecting the dots and figuring out the "why" behind what people are saying.
Integrating AI for Deeper Understanding
The real magic happens when you can blend rich qualitative findings with hard numbers. AI makes this connection stronger and faster than ever before. For instance, some tools can process over 60,000 hours of text from audio recordings and map the frequency of certain themes against metrics like a customer's Net Promoter Score (NPS).
This isn't just a niche technique anymore. A Deloitte report found that 75% of Fortune 500 companies are using qualitative analysis to shape their customer experience. By using AI to power their thematic analysis, they're generating insights up to 80% faster. To learn more, check out Fullstory's great piece on the impact of qualitative data on business decisions on fullstory.com.
Common Questions About Qualitative Data Analysis
Even when you have a solid plan, a few practical questions always pop up once you're in the thick of a qualitative project. Let's tackle some of the most common hurdles researchers face so you can move forward with confidence.
Thematic vs. Content Analysis: What’s the Real Difference?
It’s easy to mix these two up, but the key difference is your goal. Think of it like this: thematic analysis is about finding the story behind the words. You’re interpreting the data to uncover underlying patterns and meanings—the big "themes" that run through all your interviews or texts. It answers the question, "What are people really talking about here?"
Content analysis, on the other hand, is often more about counting. It’s a more descriptive method where you might identify how many times a specific word, phrase, or concept appears. This helps answer the question, "How often is X mentioned?"
How Many Interviews Are Enough?
This is the classic "how long is a piece of string?" question. There's no magic number. The goal isn't just to collect more data; it's to reach data saturation.
Saturation is the point where conducting another interview doesn't really teach you anything new. You start hearing the same stories, the same pain points, and the same ideas. For many focused studies, you might hit this point after just 10 to 15 really solid, in-depth interviews.
Key Insight: The quality of your interviews will always trump the quantity. A handful of rich, detailed conversations can be far more revealing than dozens of surface-level chats. You’ve done enough when you can confidently explain the phenomenon you’re studying without any major gaps.
How Can I Avoid Personal Bias?
The short answer? You can't, not completely. But you can manage it. The most important step is simply acknowledging that you have biases—we all do. Being transparent about your own perspective is crucial.
A powerful tool for this is a reflexivity journal. This is just a separate document where you jot down your own thoughts, assumptions, and emotional reactions during the analysis. It creates a space to question your interpretations, helping you separate what a participant actually said from the meaning your own experiences might be adding. Another great check is to have a colleague review your codes and themes to see if they spot the same patterns.
Can I Combine Qualitative and Quantitative Data?
Yes, and you absolutely should when possible! This is called mixed-methods research, and it often produces the most complete and compelling findings. It's the best way to connect the "what" with the "why."
Imagine your company's analytics show a sudden drop in user engagement on a key feature—that's the quantitative "what." It tells you there's a problem, but not why it's happening. By conducting a few user interviews, you might discover a recent update made a button confusing to find. That's your qualitative "why." Together, the two data types give you a full picture and a clear path to a solution.
Ready to stop wasting hours on manual transcription and start finding insights faster? Whisper AI can transcribe your interviews and meetings in minutes with incredible accuracy, complete with speaker labels and automatic summaries. See for yourself how thousands of researchers, marketers, and creators are accelerating their workflow. Try it for free and get your first transcript back in minutes at https://whisperbot.ai.