Mastering Qualitative Research Analysis Methods
Qualitative research analysis methods are the systematic tools we use to make sense of non-numerical data—things like interview transcripts, open-ended survey responses, or observational notes. They give us a structured way to sift through this often messy, unstructured information to find patterns, themes, and genuine insights.
Understanding Qualitative Research Analysis
At its core, qualitative analysis is about finding meaning in words, stories, and observations. It’s fundamentally different from quantitative research, which is all about numbers and statistical significance. Here, we’re digging into the why and how of human behavior and experience.
Think of yourself as a detective. You’re not just counting clues; you're piecing together witness statements and evidence to uncover the hidden narrative that ties everything together. The real goal is to move beyond simply reporting what people said and start interpreting what they truly meant.
Without a structured method, you can easily get lost in a sea of data. You might end up just describing what you found instead of analyzing it. A good analytical framework makes your process rigorous, transparent, and, most importantly, defensible. It’s the map that guides you from raw data to a compelling, well-supported conclusion.
The Foundation of Interpretive Work
The way you interpret your data is just as critical as the data itself. How you choose to organize, code, and connect different ideas will fundamentally shape the final story you tell. This interpretive process is what allows you to build a rich, nuanced understanding of your research topic.
A few key steps are universal to this journey:
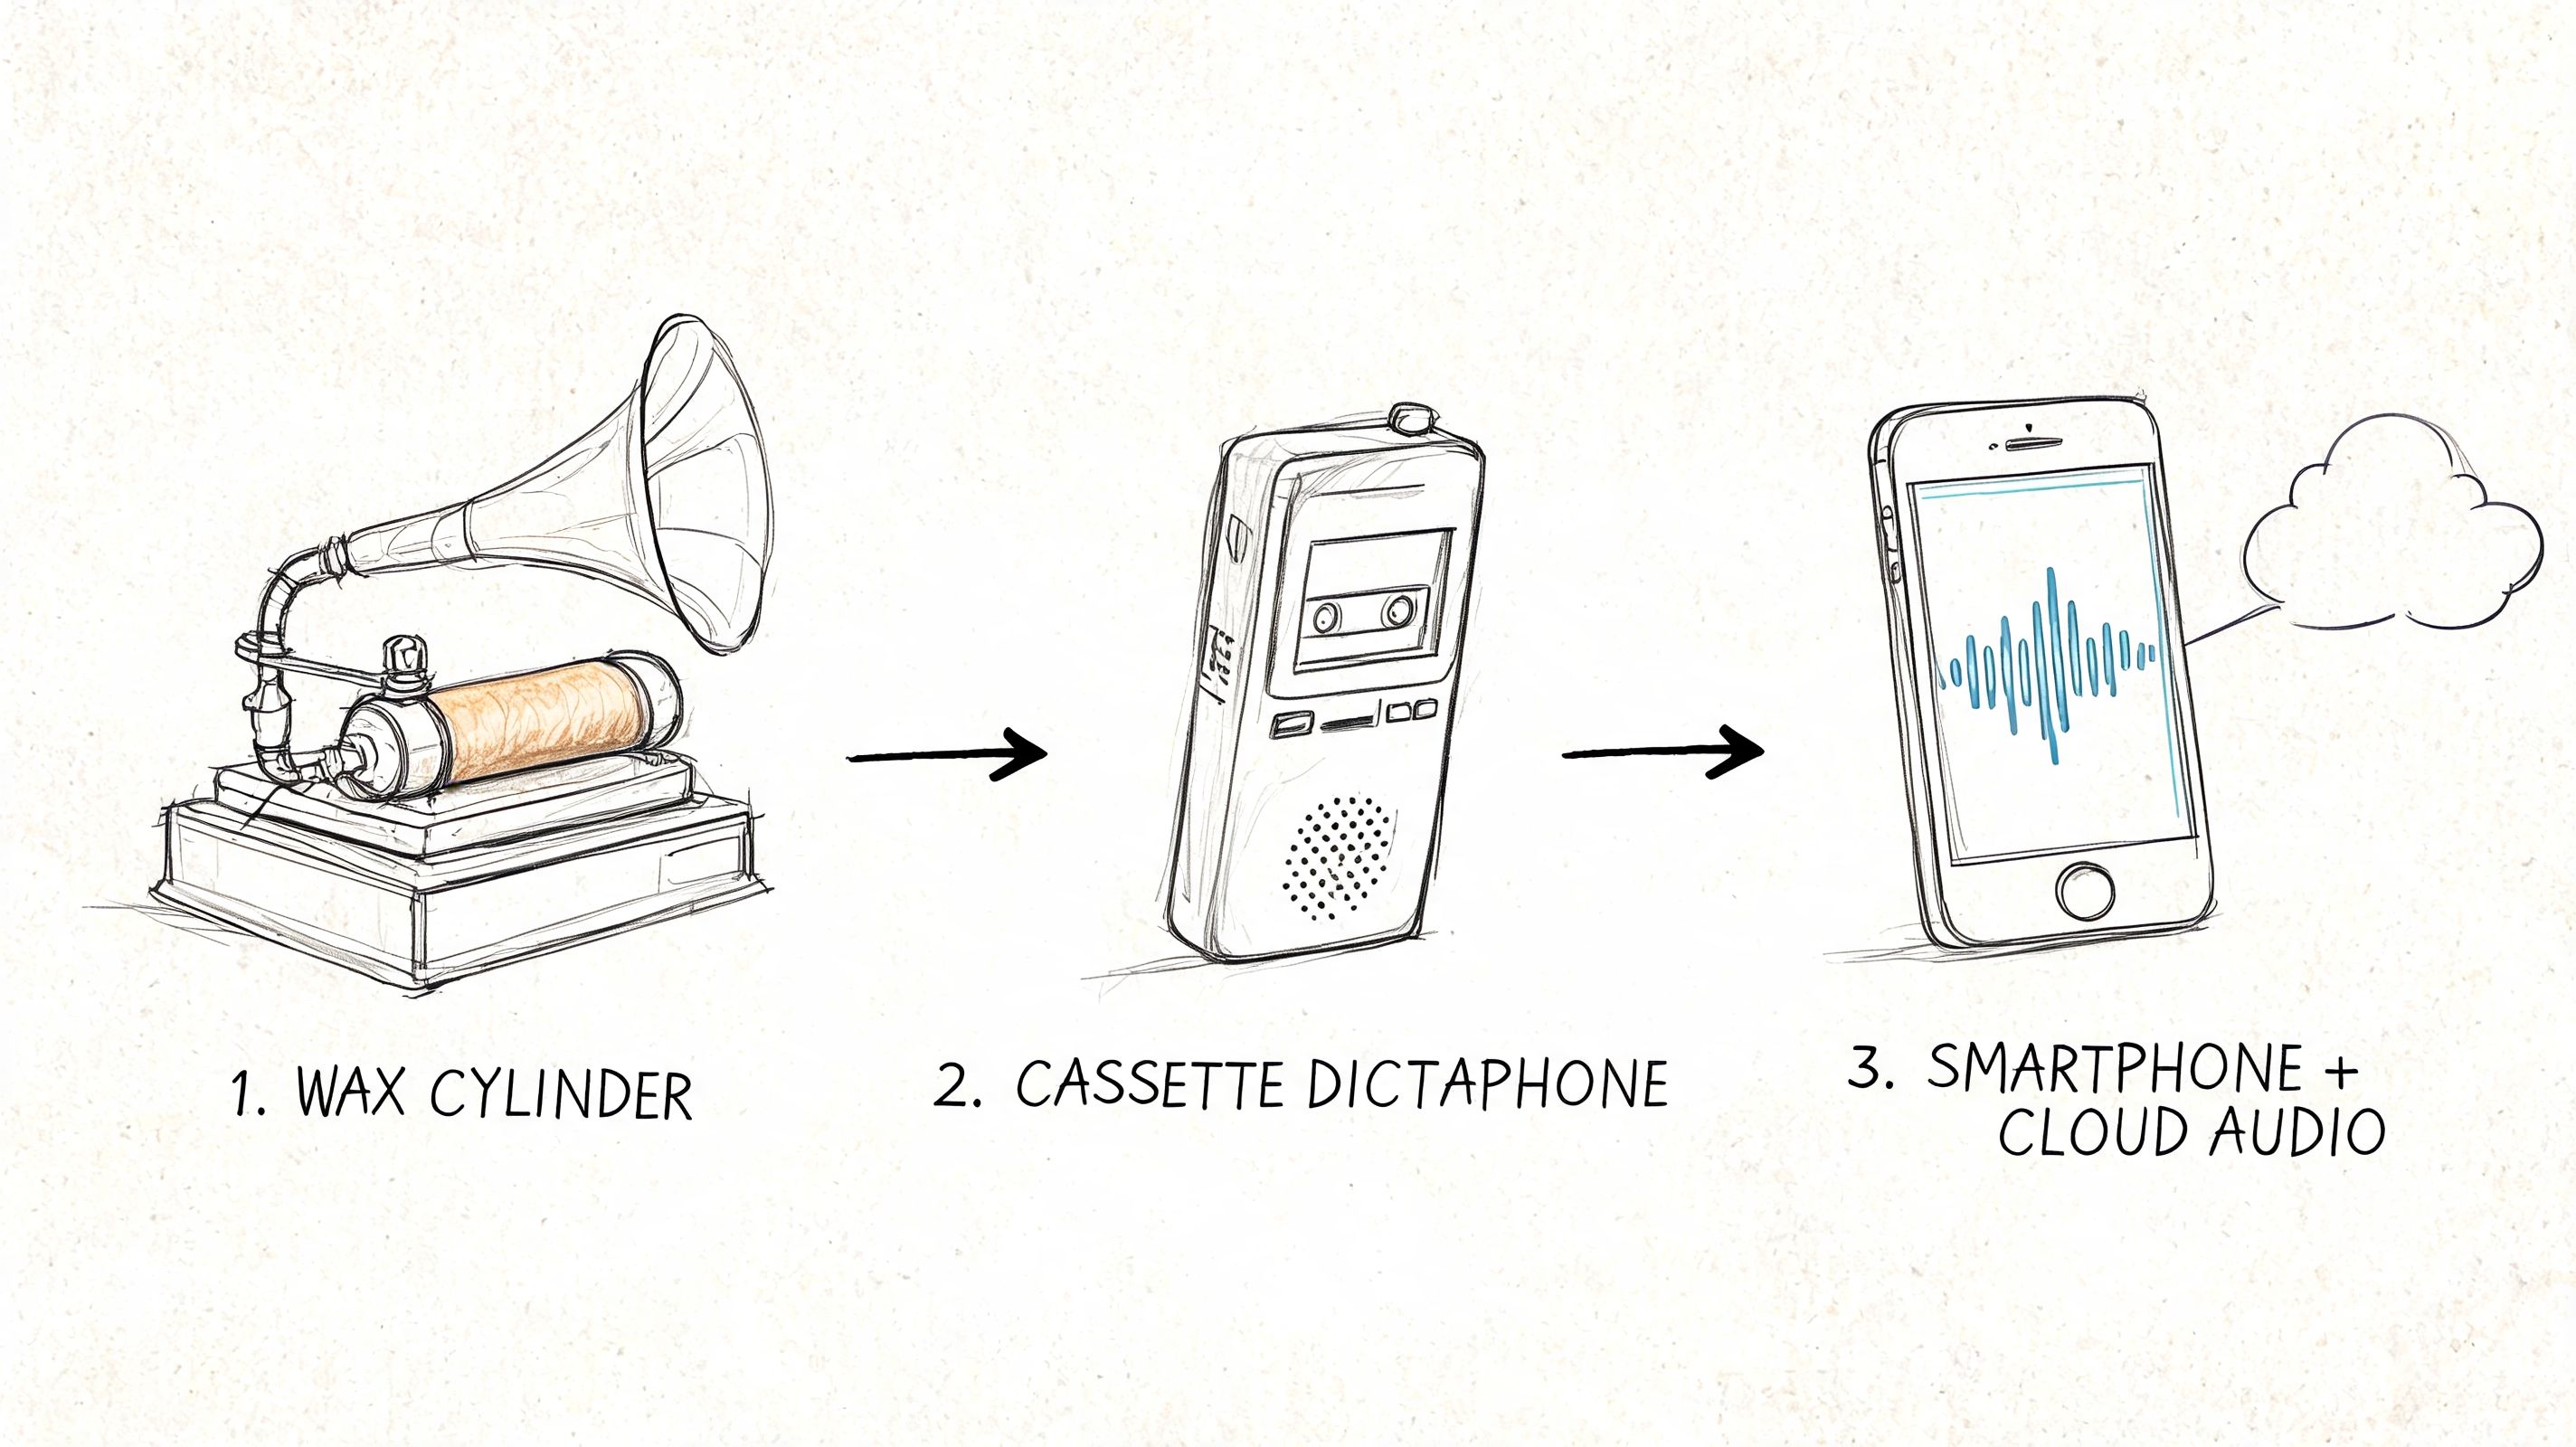
- Data Preparation: Before you can do anything, you need to get your raw data into a usable format. For interviews and focus groups, this almost always means transcription. Using precise AI-powered tools for converting audio to text can save you a ton of time on this crucial first step.
- Immersion: You have to get to know your data inside and out. Read it, then read it again. This deep immersion helps you absorb the context, tone, and subtleties that a quick skim would miss.
- Systematic Organization: Applying a specific method gives you a system for organizing your thoughts and spotting connections that aren't immediately obvious.
Why This Approach Matters
Qualitative research isn't just a niche academic pursuit; its importance has exploded across countless fields. Why? Because it has a unique power to uncover complex social realities that numbers alone simply can’t capture.
You can see this shift in academic trends. For example, a review of major psychology journals found that the use of qualitative studies grew from less than 5% to over 20% between 1970 and 2000. You can read more about the historical adoption of these methods in psychology to see how far it has come.
By focusing on context and meaning, qualitative research analysis methods allow us to understand the world from the perspective of those we study, providing depth that complements statistical findings.
With this foundation, you’ll be much better prepared to choose the right analytical approach for your specific research questions.
6 Common Qualitative Research Analysis Methods
Picking the right qualitative analysis method is a lot like choosing the right lens for a camera. Each one brings a different part of the picture into focus. You wouldn't use a wide-angle lens for a close-up portrait, and you wouldn't use grounded theory when a simple thematic analysis will do.
Your choice of method is critical—it shapes everything that follows, from how you interpret your data to the kinds of insights you can actually pull from it.
Let's walk through six of the most common and powerful approaches. We'll break down what makes each one tick, when it's the right tool for the job, and what kind of story it helps you tell. The idea is to give you a clear roadmap for moving from a pile of raw data to a compelling, well-supported analysis.
No matter which method you choose, your starting point is always the same: rich, detailed, non-numerical data.
Whether you're working with interview transcripts, field notes, or documents, these are the raw materials. Now, let's explore the different ways to make sense of it all.
1. Thematic Analysis: Finding the Big Patterns
If you're just getting started with qualitative analysis, thematic analysis is your best friend. It’s flexible, straightforward, and probably the most common method out there. The goal is simple: find and analyze patterns—or "themes"—that pop up again and again in your data.
Think of it as sorting a giant, messy pile of LEGOs. Before you can build anything, you need to group the bricks by color, size, and shape. That’s exactly what you're doing here. You’re not trying to force a conclusion; you're just organizing your data into meaningful clusters to see what you’re working with.
For example, a UX team sifting through customer support tickets might use thematic analysis to spot recurring issues. They could quickly find themes like “login problems,” “confusion about the new dashboard,” and “positive feedback on response times.”
Thematic analysis is powerful because it gives you a rich, detailed, and organized overview of your data. It often serves as the perfect foundation for other, more complex types of analysis.
Its accessibility and practical nature make it a go-to method in almost every field, from market research to public health.
2. Content Analysis: Quantifying What People Say
Content analysis is the method you use when you want to bring numbers into the picture. It systematically catalogs and counts how often certain words, phrases, or ideas appear in a text. By turning qualitative data into quantitative data, it lets you step back and see the forest for the trees.
It's less about deep interpretation and more about objective measurement.
Imagine you're trying to figure out how media outlets are covering a new policy. You could use content analysis to count how many articles frame the policy as "innovative" versus "risky." This gives you hard numbers to back up your claims, like, "Newspapers used the term 'risky' 57 times more often than 'innovative' in the first month."
This approach is perfect for:
- Spotting Trends: Seeing how language around a topic changes over time.
- Making Comparisons: Objectively comparing how two different brands talk about their products.
- Finding the Focus: Pinpointing the main emphasis in a large set of documents, like political speeches or annual reports.
While it can feel a bit rigid, content analysis offers a clear, repeatable way to identify the most prominent messages in your data.
3. Narrative Analysis: Unpacking the Power of Stories
We make sense of our lives through stories. Narrative analysis zeroes in on these stories—how people construct them, what they reveal, and why they matter. The focus isn't just on what was said, but how it was said. You look at things like plot, character, and conflict to understand someone's experience from their point of view.
A researcher studying burnout among teachers wouldn't just look for themes of "stress" or "long hours." Instead, a narrative analyst would piece together an individual teacher's whole story—the initial passion, the mounting challenges, the turning point. This reveals the personal journey, not just a list of complaints.
This method is incredibly powerful for getting at lived experiences, personal identity, and the culture of an organization. It honors the individual's voice and treats their story as a valuable piece of data in its own right.
4. Grounded Theory: Building Theory from the Ground Up
Grounded theory is one of the heavy hitters. It’s an ambitious method where your goal isn't just to describe what’s in the data, but to generate a brand-new theory that explains it. You start with a question, not a hypothesis. The theory emerges from—or is "grounded" in—the data itself.
This is pure detective work. You don't walk into the crime scene with a suspect already in mind. You gather clues (data), look for patterns (codes), and slowly build a case that explains all the evidence. It’s an iterative process of constantly comparing new data against your developing theory until it all fits together.
A sociologist studying how online communities form could use grounded theory to build a model that explains the stages of community development. This model would come directly from observing and interviewing members, not from a textbook.
5. Discourse Analysis: Looking at Language, Power, and Context
Discourse analysis is about reading between the lines. It examines how language works in the real world—how it builds relationships, creates identities, and reinforces power structures. It moves beyond the literal meaning of words to ask a bigger question: "What is this language doing here?"
Think about the difference between calling a new development "gentrification" versus "urban renewal." Discourse analysis unpacks how those two phrases create completely different social and political realities for the people involved. It’s all about uncovering the hidden assumptions and power dynamics embedded in our everyday communication.
This method is a favorite in fields like political science, media studies, and sociology, where researchers might analyze anything from parliamentary debates to social media posts to reveal how language shapes our world.
6. Phenomenological Analysis: Capturing the Essence of an Experience
If you want to understand what an experience is truly like for someone, phenomenological analysis is the way to go. It’s a deeply empathetic approach that aims to describe the essential nature of a lived experience from the perspective of the people who have lived it.
The central question is always, "What is the essence of this experience?" A researcher might use it to explore the lived experience of being a first-generation college student, of surviving a natural disaster, or of learning a musical instrument. The goal is to set aside all preconceptions—a process called bracketing—to grasp the raw, subjective reality of that experience.
This involves deep, unstructured interviews where you let the participant guide the conversation. You then search for the core meanings and structures that define the phenomenon for everyone who shared their story. It offers incredibly profound insights into what it means to be human.
Choosing Your Qualitative Analysis Method
With so many options, how do you choose the right one? The best method depends entirely on your research question and what you want to achieve. This table breaks down the core focus of each approach to help guide your decision.
Ultimately, the right method is the one that best aligns with your curiosity. Are you looking for broad patterns? Go with thematic analysis. Want to build a new model from scratch? Grounded theory is your path. By understanding what each method offers, you can confidently select the approach that will unlock the deepest insights from your data.
A 5-Step Guide to the Analysis Process
So, you've got a pile of interview transcripts, focus group notes, or open-ended survey responses. Now what? Knowing the different analysis methods is great, but the real work starts when you have to turn that mountain of raw data into a clear, compelling story.
While every qualitative project is unique, there’s a general path most of us follow. It’s less of a straight line and more of a spiral—you’ll often circle back to earlier steps. But thinking about it as a process makes it far less daunting.
Let's walk through a practical, five-step workflow that you can adapt for just about any qualitative study. To keep things concrete, we’ll use a running example: analyzing customer interviews about their experience with a new mobile app.

Step 1: Prepare and Organize Your Data
Before you can even think about finding insights, you have to get your data in order. This is the foundational housekeeping that saves you from massive headaches later. Your goal is a clean, consistent, and accessible dataset. For interviews or focus groups, this almost always means transcription.
This is one area where technology has been a game-changer. A 2020 survey found that over 75% of qualitative researchers now use digital tools. And the adoption of computer-assisted qualitative data analysis software (CAQDAS) has jumped by more than 60% since 2010. We're well past the days of printing everything out and using highlighters (though I still love a good highlighter).
Back to our app example: this step involves transcribing the audio from our customer interviews into text. Each transcript needs to be labeled clearly with a participant ID (use pseudonyms to protect privacy!), the date, and any other context that might be important.
Step 2: Immerse Yourself in the Data
Once everything is organized, it's time to dive in. I mean really dive in. Read through every transcript. Listen to the audio again. Go over your field notes. The point here isn't to start analyzing but to simply get a feel for the data as a whole.
Think of it like walking into a room you need to organize. You don't just start grabbing things; you stand in the doorway for a minute and take it all in. You're just absorbing the content, noticing the tone people use, the specific words that pop up, and any gut feelings or initial impressions that surface.
A great habit to start during this phase is keeping an analytical memo or a research journal. This is just a separate document where you can jot down your thoughts, questions, and early hunches as they come to you. For our app interviews, you might write something like, "Huh, several users have mentioned feeling 'overwhelmed' by the dashboard. I need to keep an eye out for that."
Step 3: Code Your Data Systematically
Coding is the bread and butter of most qualitative analysis. It’s the process of attaching short labels (or "codes") to chunks of your data to identify what they're about. A code is just a word or short phrase that captures the essence of a sentence, a paragraph, or even a single powerful quote.
You can come at this from a couple of angles:
- Deductive Coding: This is when you start with a pre-set list of codes based on your research questions or an existing theory. For our app study, we might start with codes like "Usability Issues," "Feature Requests," and "Positive Feedback."
- Inductive Coding: Here, you let the codes emerge directly from the data. You don't start with a framework; you build it from the ground up. This is much more exploratory. You might create codes like "Confusing Navigation" or "Loves Dark Mode" as you read through the transcripts.
As you apply these codes, you're systematically breaking down your data into manageable, meaningful pieces. This isn't just about organizing; it's about starting to see what's really there. If you want to get deeper into the nitty-gritty of this stage, our guide on how to analyze interview data is a great resource.
Step 4: Develop Categories and Themes
After your first pass at coding, you’ll probably have a long, messy list of codes. That's perfectly normal. The next step is to bring some order to the chaos by looking for patterns and grouping similar codes into broader categories. These categories are the building blocks for your overarching themes.
A theme isn’t just a summary; it’s a significant, recurring idea that helps answer your main research question. It’s the story that your data is trying to tell you.
Think of it this way: codes are the individual bricks. Themes are the walls you build with them. A single brick doesn't tell you much, but once you start putting them together, a structure begins to emerge.
For instance, you might notice you have codes like "Can't find settings," "Too many buttons," and "Unclear icons." You could group all of these into a category called "Navigation Difficulties." This category, combined with others, might then point to a major theme like: "Users Struggle with a Steep Learning Curve Due to a Complex UI."
Step 5: Interpret and Craft Your Narrative
This is the final and most crucial step. You have your themes, and now you have to figure out what they mean. You need to move from describing what the data says to explaining so what? You interpret your themes, connect them back to your original research questions, and build a coherent narrative that tells the story of your findings.
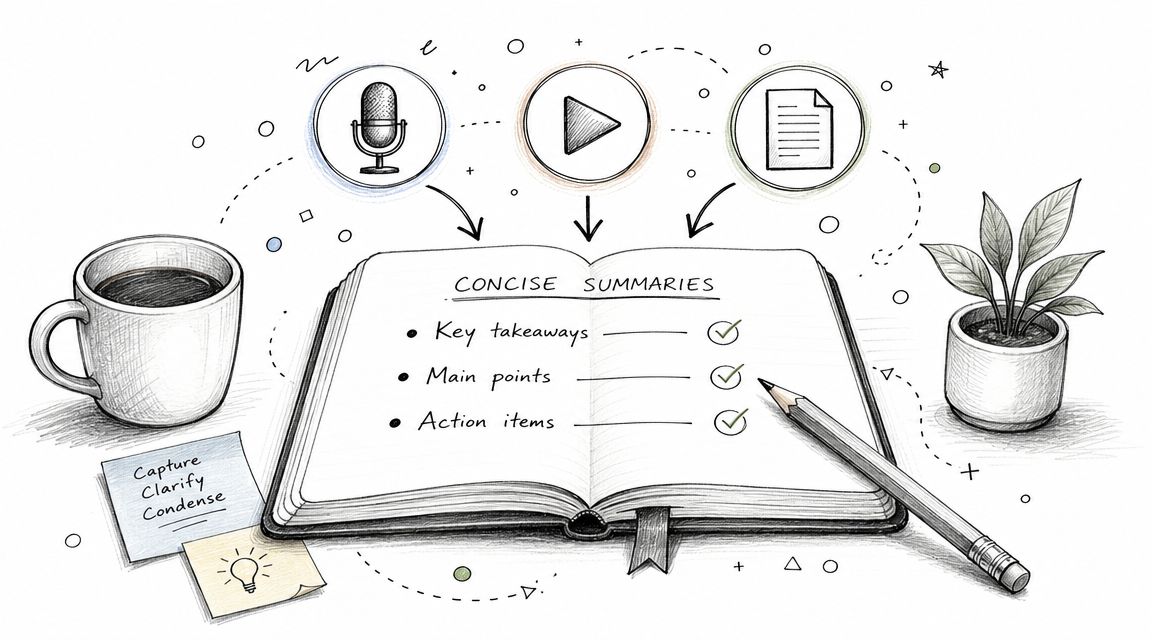
Your story needs to be backed by evidence. Pull powerful quotes and specific examples from your data to bring each theme to life. Your goal is to create a report or presentation that is not only accurate but also insightful, persuasive, and memorable.
For our app study, the final report would lay out the key themes, like the "steep learning curve." But it wouldn't stop there. It would explain what this means for the product's future, offering actionable insights like, "Simplifying the dashboard is critical for improving user onboarding and retention," all supported by the real words of the customers you interviewed.
Avoiding the Common Traps in Qualitative Analysis
Even the most meticulously planned study can go off the rails during the analysis phase. When you’re deep in the data, it's easy to fall into a few common traps that can undermine the integrity of your findings. Think of what follows as a field guide to navigating the trickiest parts of the journey, ensuring your conclusions are solid and trustworthy.

Knowing where the potential pitfalls are is half the battle. Let's walk through the most common ones and, more importantly, how to sidestep them from the start.
Taming Researcher Bias
Let's be honest: none of us are blank slates. We come to our research with our own unique perspectives, experiences, and assumptions. In qualitative work, that's not a bug; it's a feature—if you manage it correctly. The danger comes when unchecked bias leads you to see only what you expect, causing you to overlook contradictory evidence or twist interpretations to fit a preconceived narrative.
The goal isn't to become a robot devoid of perspective. It's to be a self-aware interpreter. Acknowledging your starting point is the first, most crucial step toward producing a more credible analysis.
The most dangerous bias is the one you don't know you have. Rigorous qualitative analysis demands that we turn the analytical lens on ourselves just as much as we do on our data.
Here are a couple of practical ways to keep your own views in check:
- Keep a Reflexivity Journal: This is your private log for tracking your thoughts, gut reactions, and evolving assumptions as you work through the data. It forces you to make your internal monologue explicit, helping you question why you’re leaning in a certain direction.
- Bring in a Peer for a Debrief: Talk through your emerging themes and interpretations with a trusted colleague who isn’t close to the project. A fresh set of eyes can instantly spot logical leaps or areas where your personal assumptions might be coloring the findings.
Going Deeper Than a Superficial Reading
One of the biggest temptations, especially when you're on a tight deadline, is to stop at the surface. This is what happens when you simply report what you found without digging into the why behind it. A superficial analysis might correctly state, "Participants felt frustrated with the checkout process." A deep analysis, however, explains the source of that frustration, the specific ways it manifests, and what it ultimately means for the user experience.
This usually happens when we rush the process and don't give ourselves enough time to really live with the data. A great habit to build is constantly asking yourself, "So what?" for every theme you uncover.
Resisting the Urge to Over-Generalize
Qualitative research is all about depth, not breadth. Because we're typically working with smaller, non-random samples, our findings are not meant to be generalized to an entire population the way a massive quantitative survey might be. It’s a huge mistake to claim that the experiences of your 15 interviewees represent all 5 million users. That’s not what this kind of work is for.
Instead, your goal is to provide a rich, detailed portrait of a specific group in a specific context. The power of your work lies in its transferability—the idea that your insights might resonate in other, similar situations, not that they are universal laws. You have to be precise and humble in how you frame your conclusions.
To keep yourself from falling into this trap:
- Clearly Define Your Scope: Be upfront about the boundaries of your study and the specific characteristics of your participants. Who were they? Where did you find them?
- Use Cautious Language: Frame your findings with phrases like, "For this group of new mothers..." or "In the context of this onboarding flow, we saw..." This avoids making sweeping, unsupported claims.
- Hunt for "Negative Cases": Actively look for the participant who contradicts your emerging theory. Digging into why their experience was different will add incredible nuance to your analysis and stop you from painting an overly simplistic picture.
Using AI to Speed Up Your Research Workflow
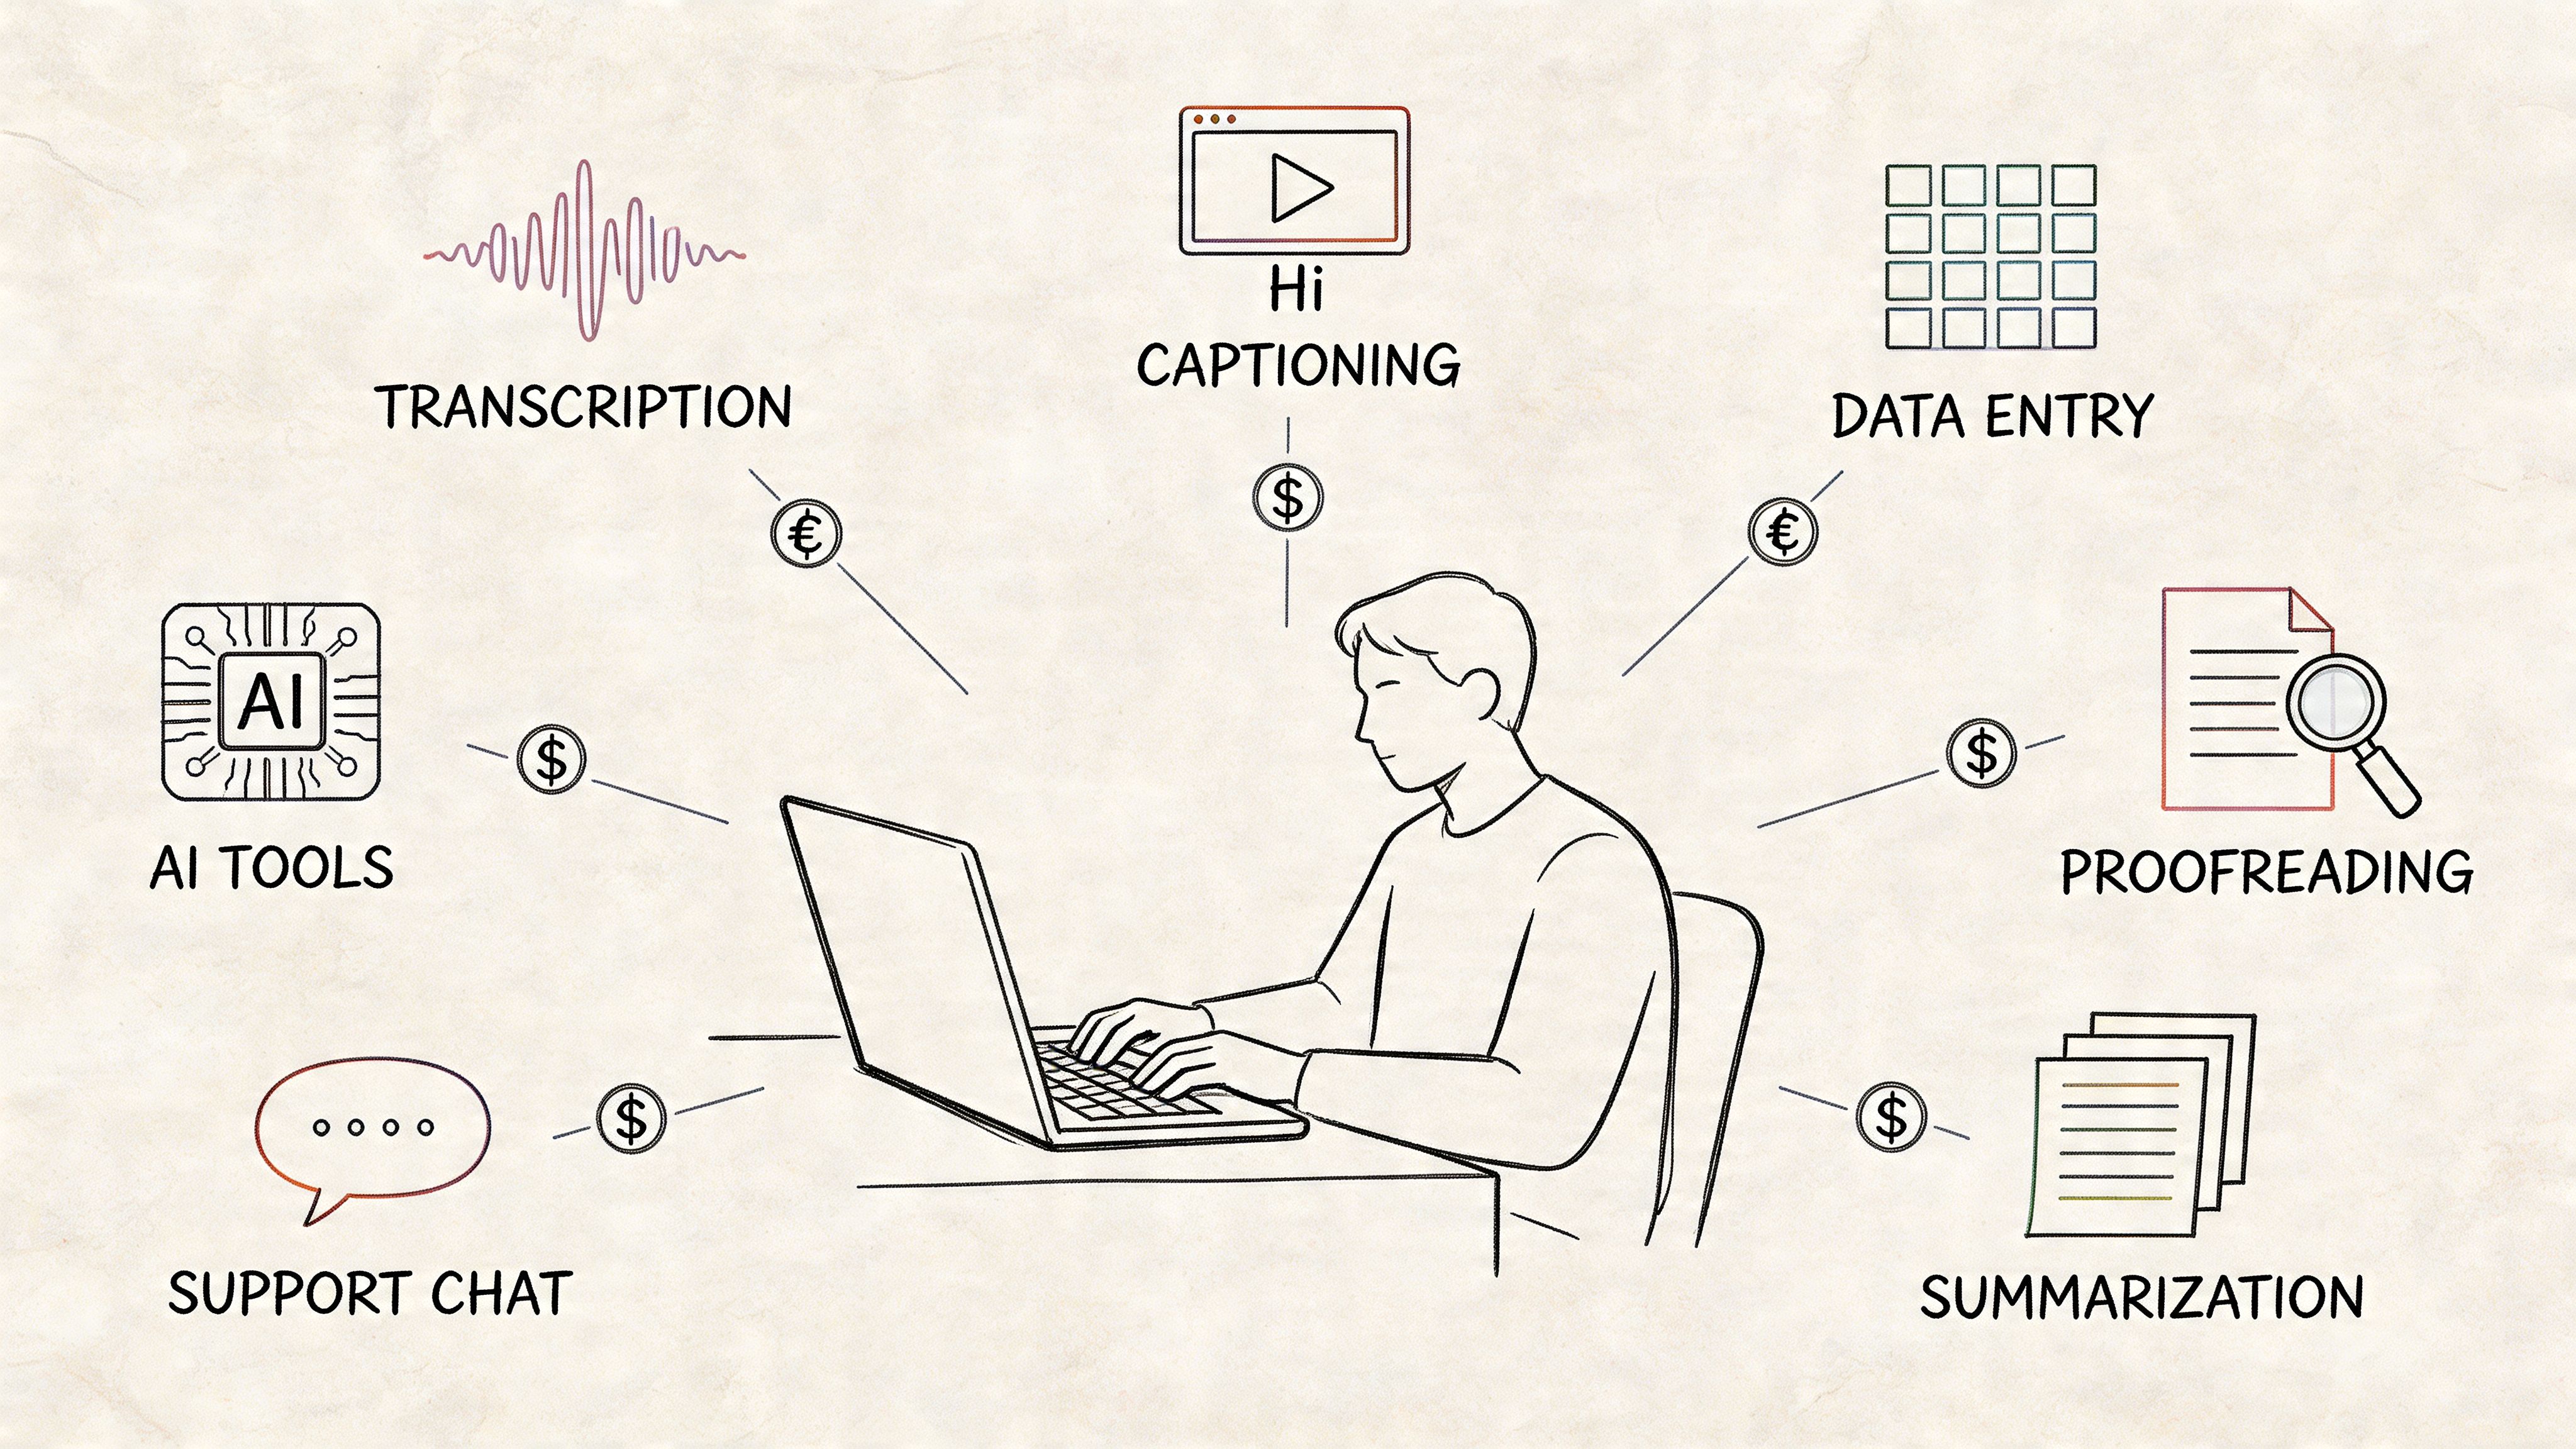
Let's be honest: some of the most tedious, time-consuming parts of qualitative research are logistical, not intellectual. Modern AI tools are stepping in to handle that grunt work, acting like a tireless research assistant so you can focus on the real thinking.
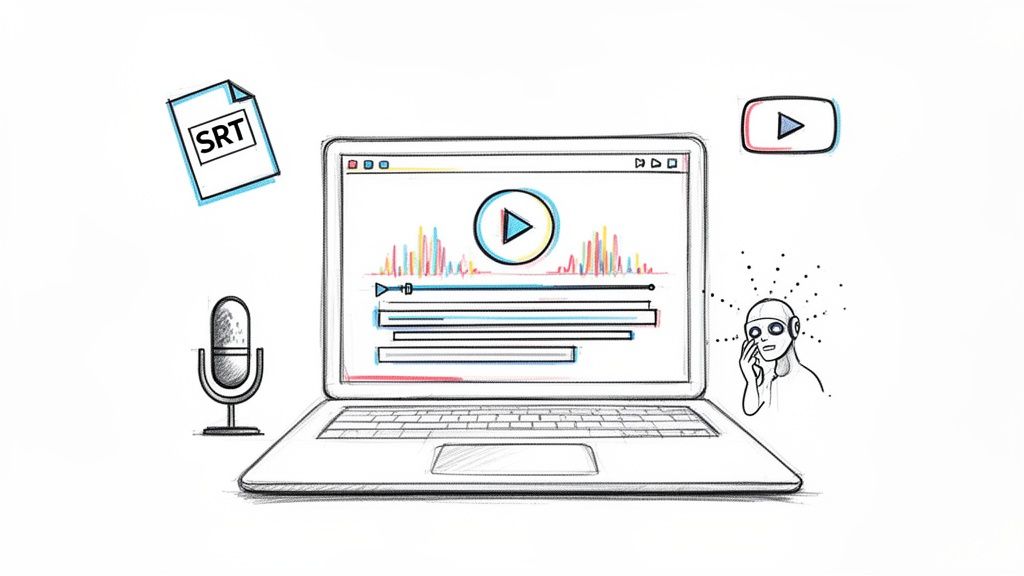
The most obvious place to start is with transcription. If you've ever done it yourself, you know the drill. Manually transcribing a one-hour interview can easily take four to six hours of intense, painstaking work. When your project involves dozens of interviews, that administrative bottleneck can delay your analysis for weeks.
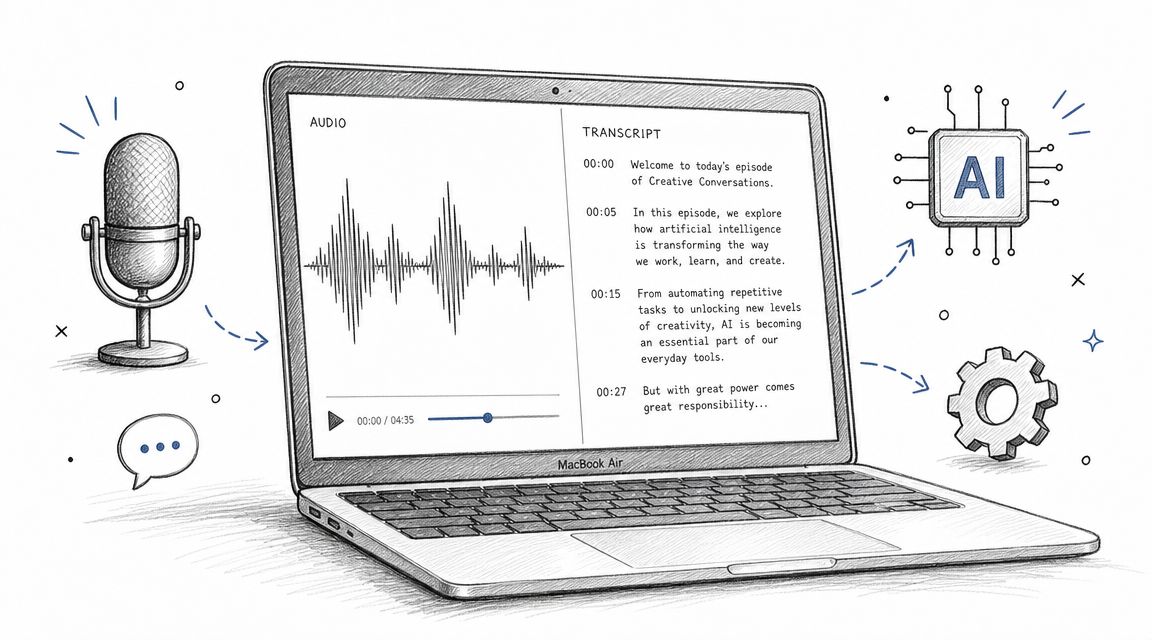
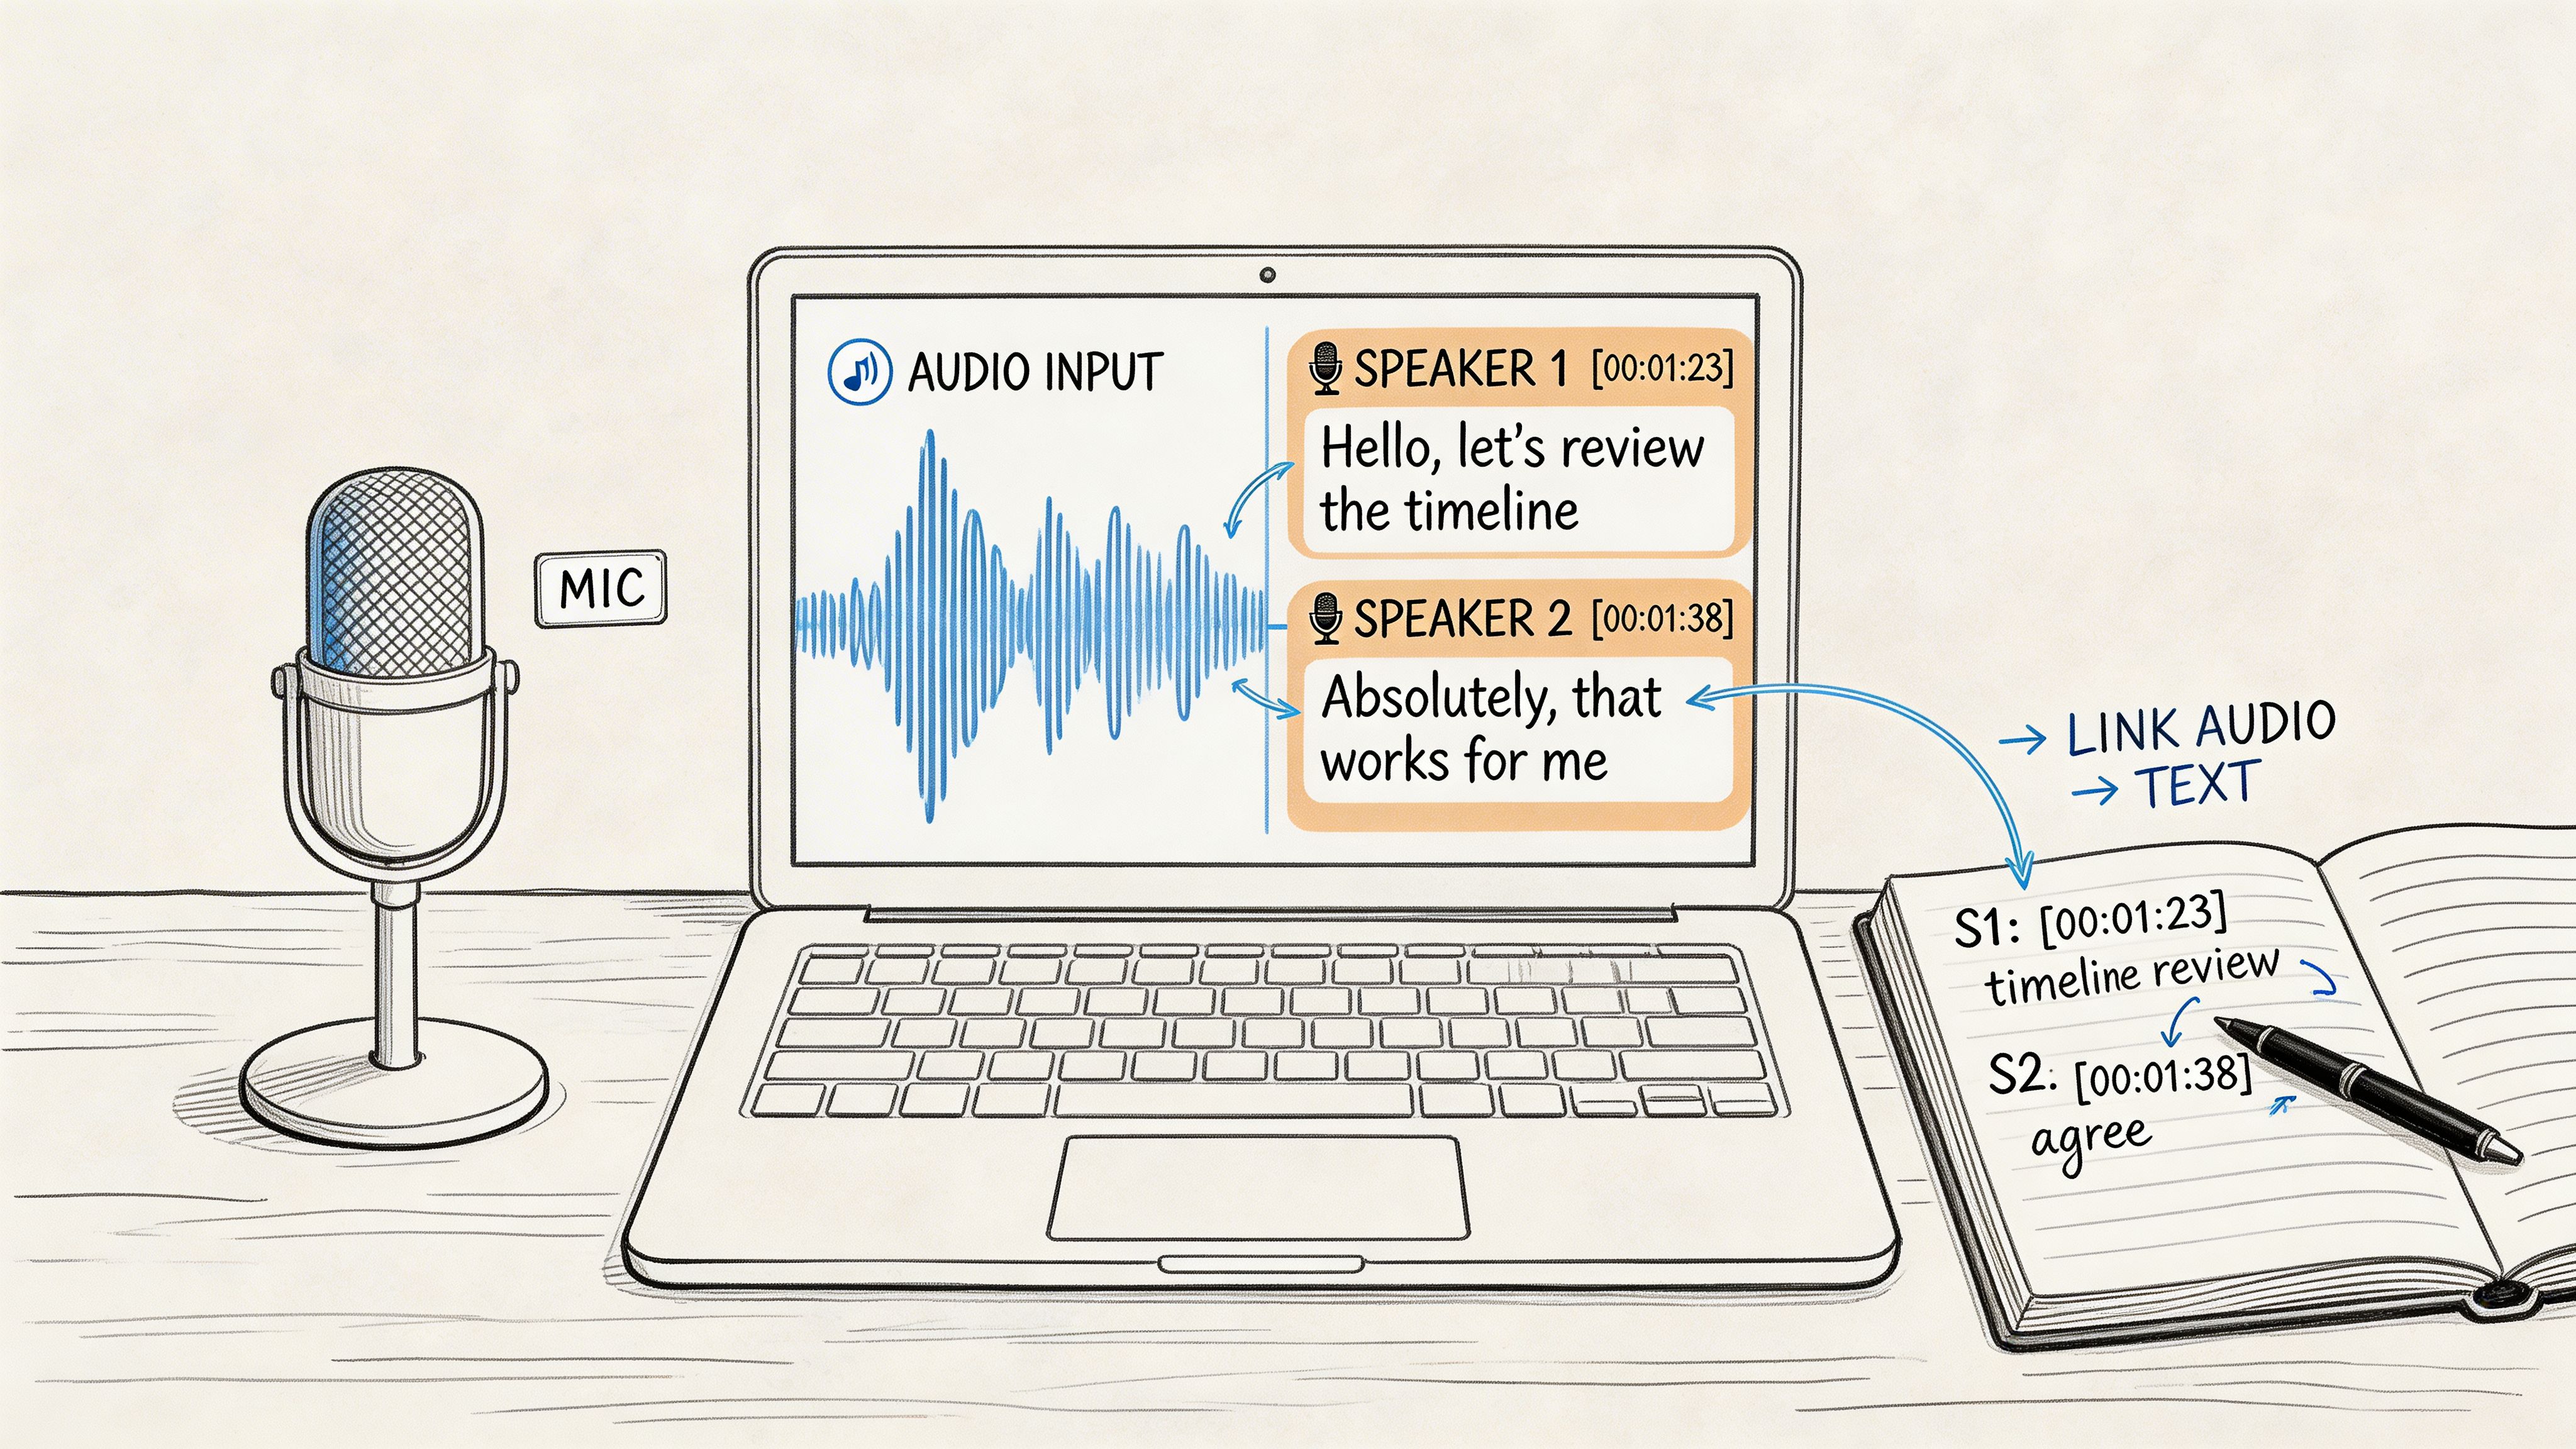
Today's AI can get that job done in minutes, and with incredible accuracy. Tools like Whisper AI chew through hours of audio, automatically identify who is speaking, and produce a clean, time-stamped transcript. This one shift can give you hundreds of hours back, kickstarting your analysis from day one.
Moving Beyond Basic Transcription
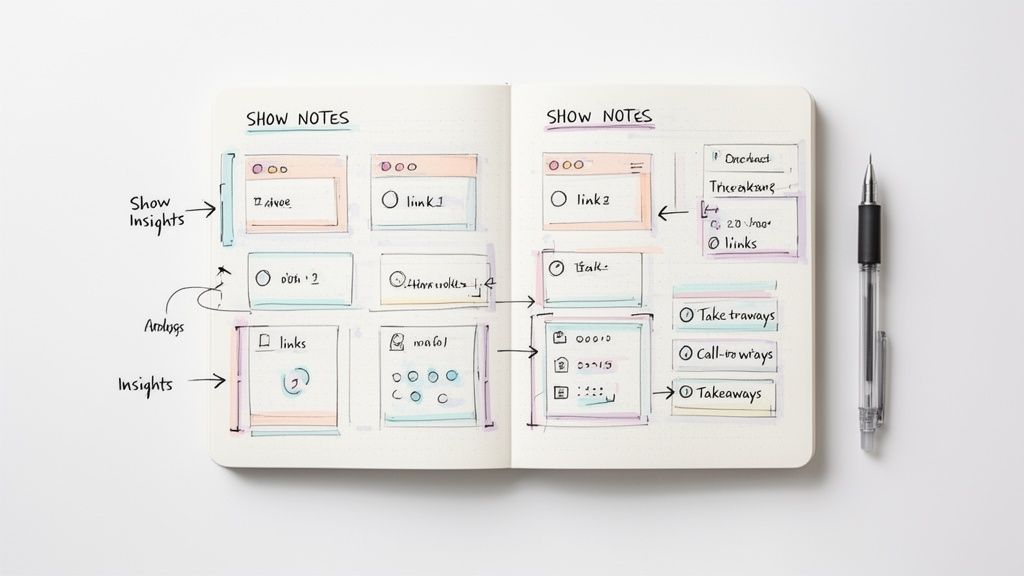
While automated transcription is a game-changer, that’s just the beginning. The real magic happens when AI starts to help you get acquainted with your data. Think of it as a first-pass analysis partner.
These tools can quickly scan your transcripts to spot recurring keywords, phrases, and even the emotional tone of the conversation. For example, an AI could instantly highlight every time a customer review mentions words like "frustrating" or "confusing," giving you a perfect entry point for building your initial codes.
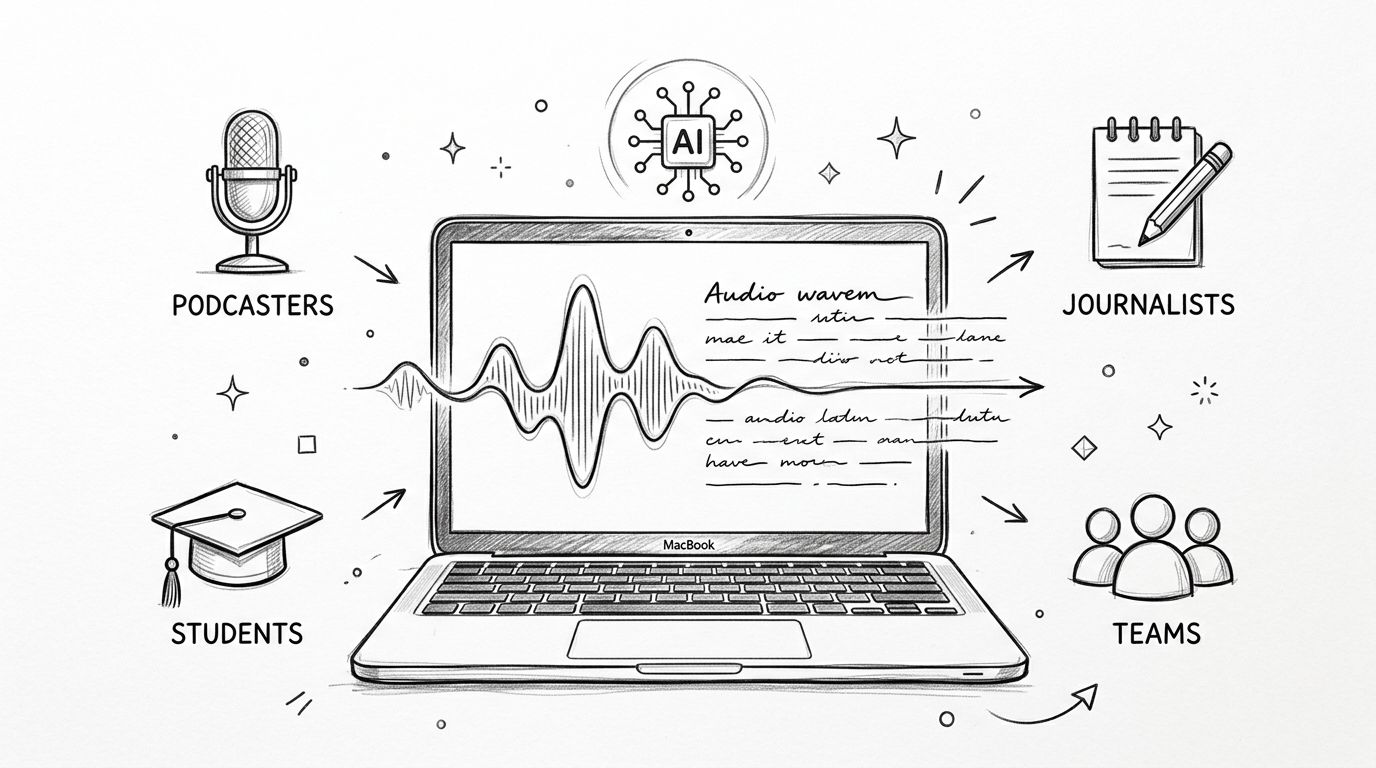
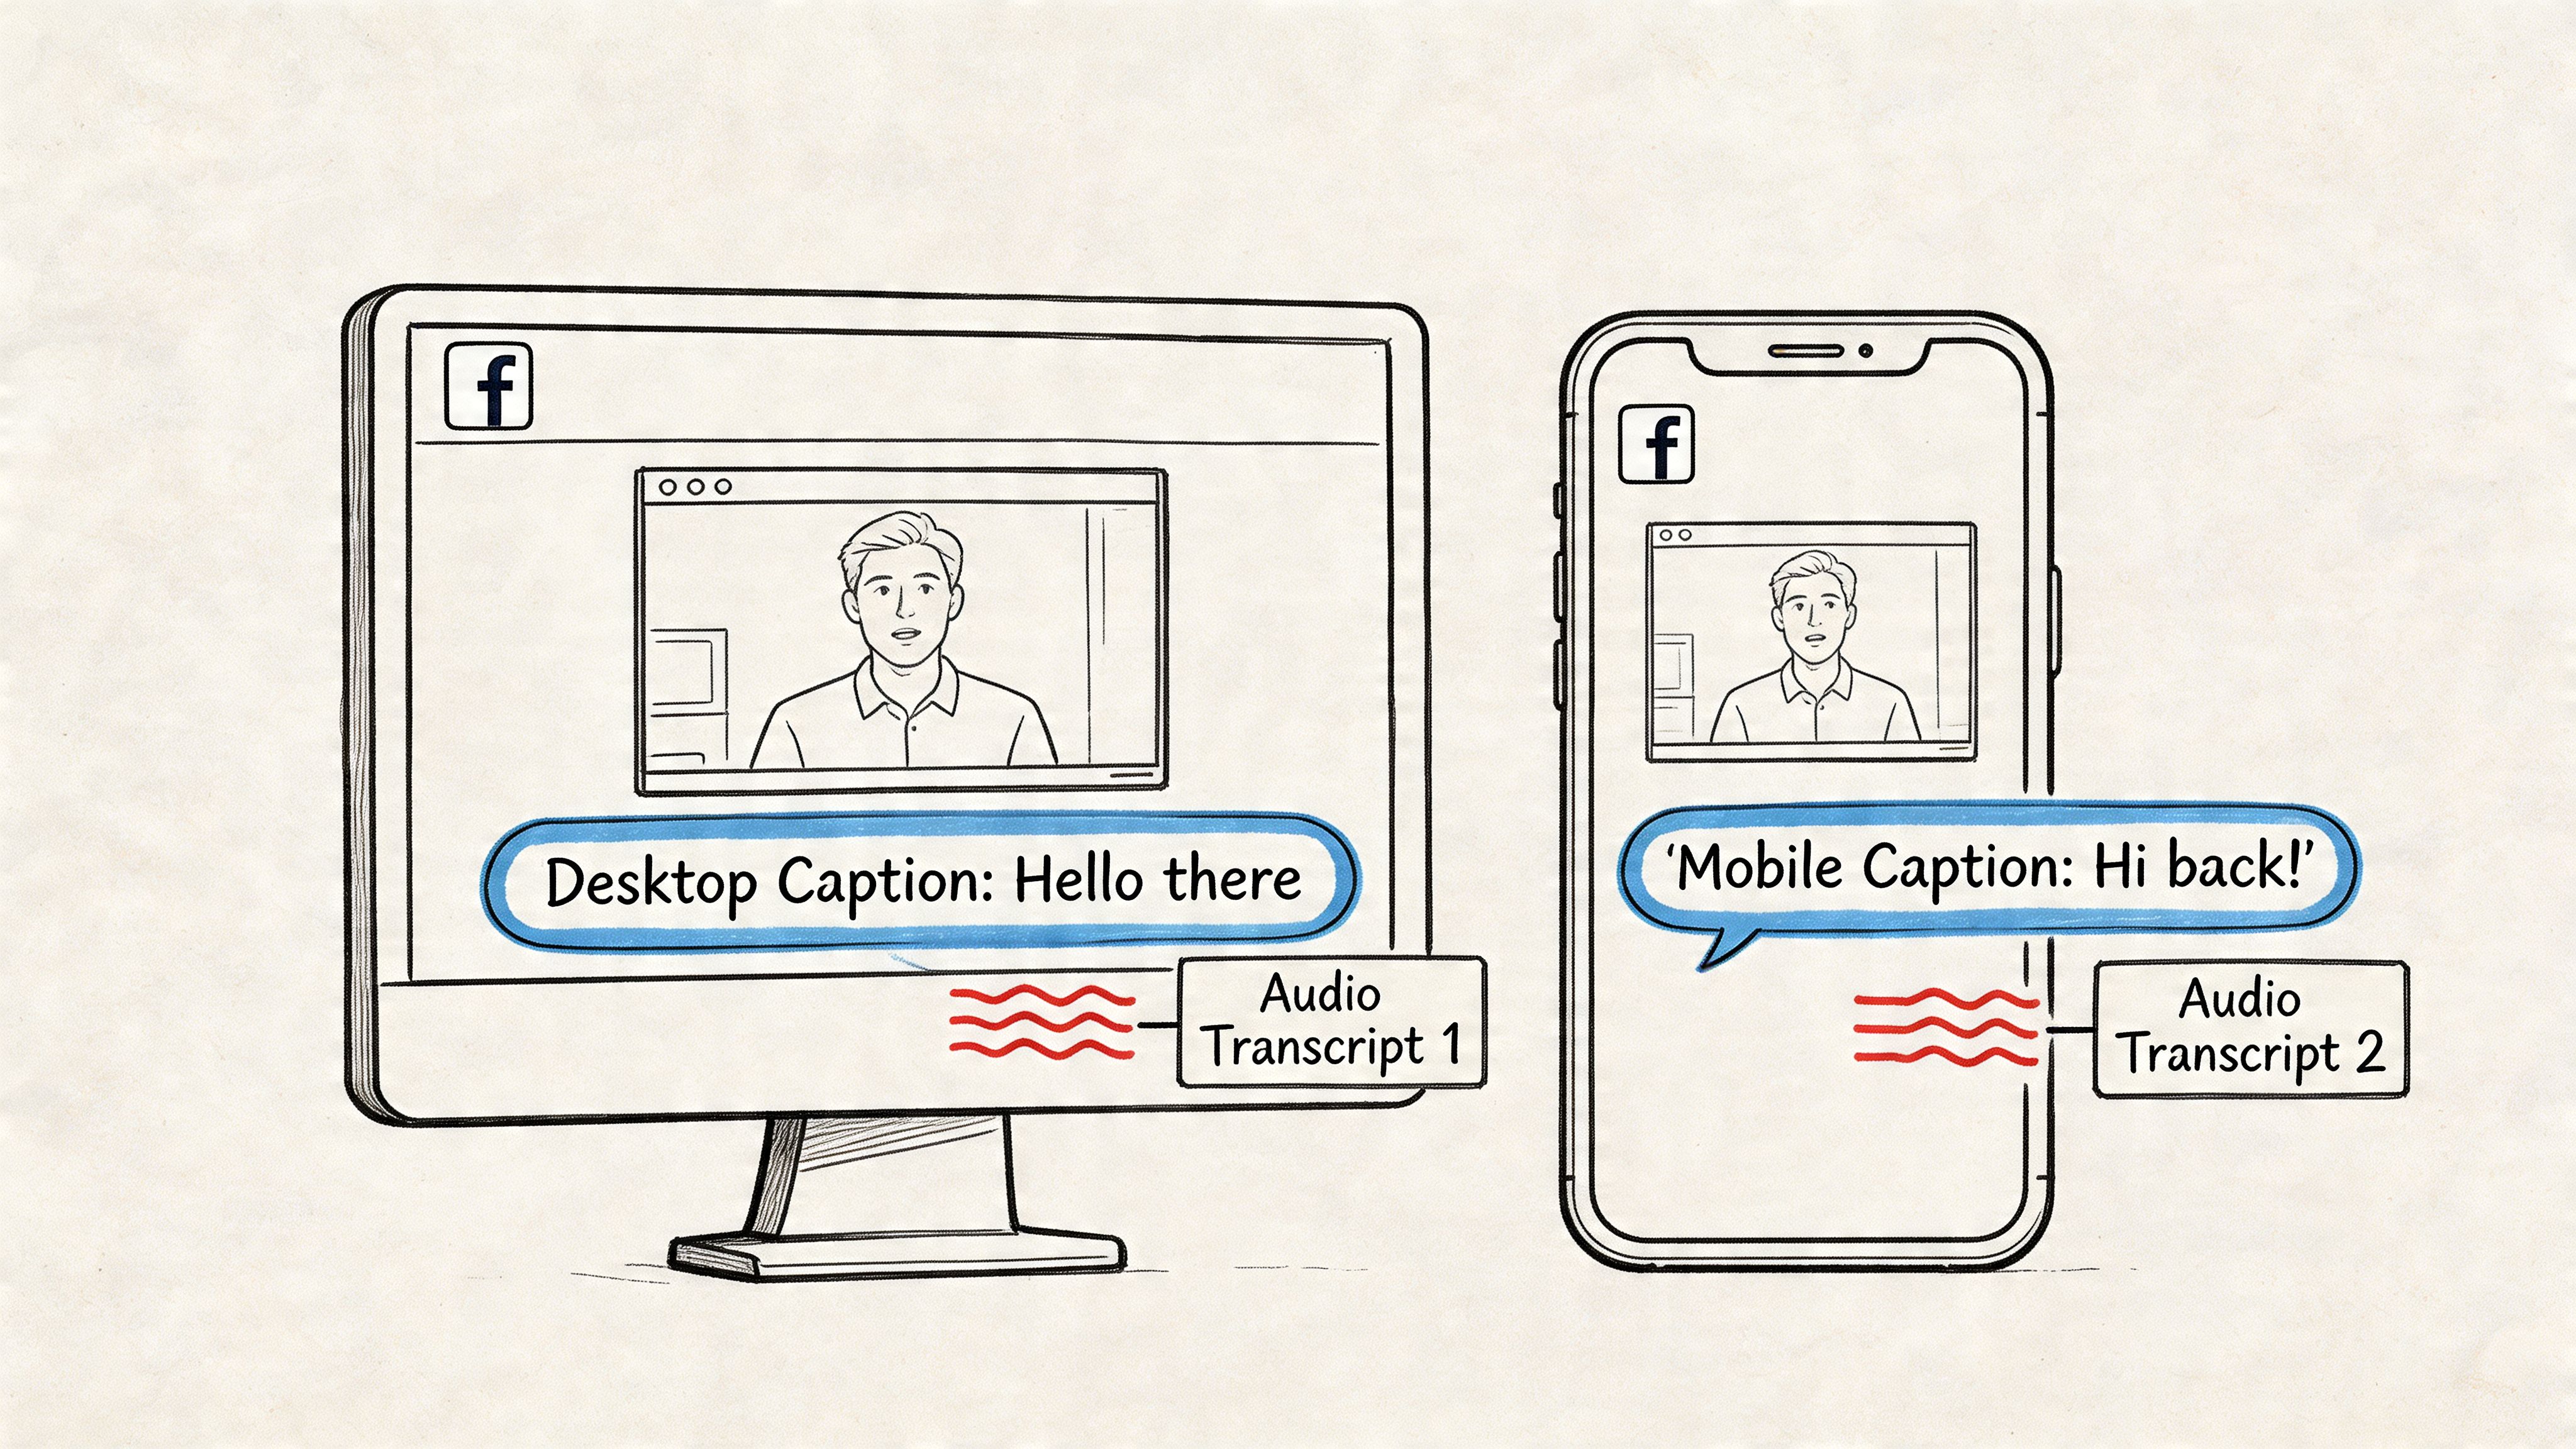
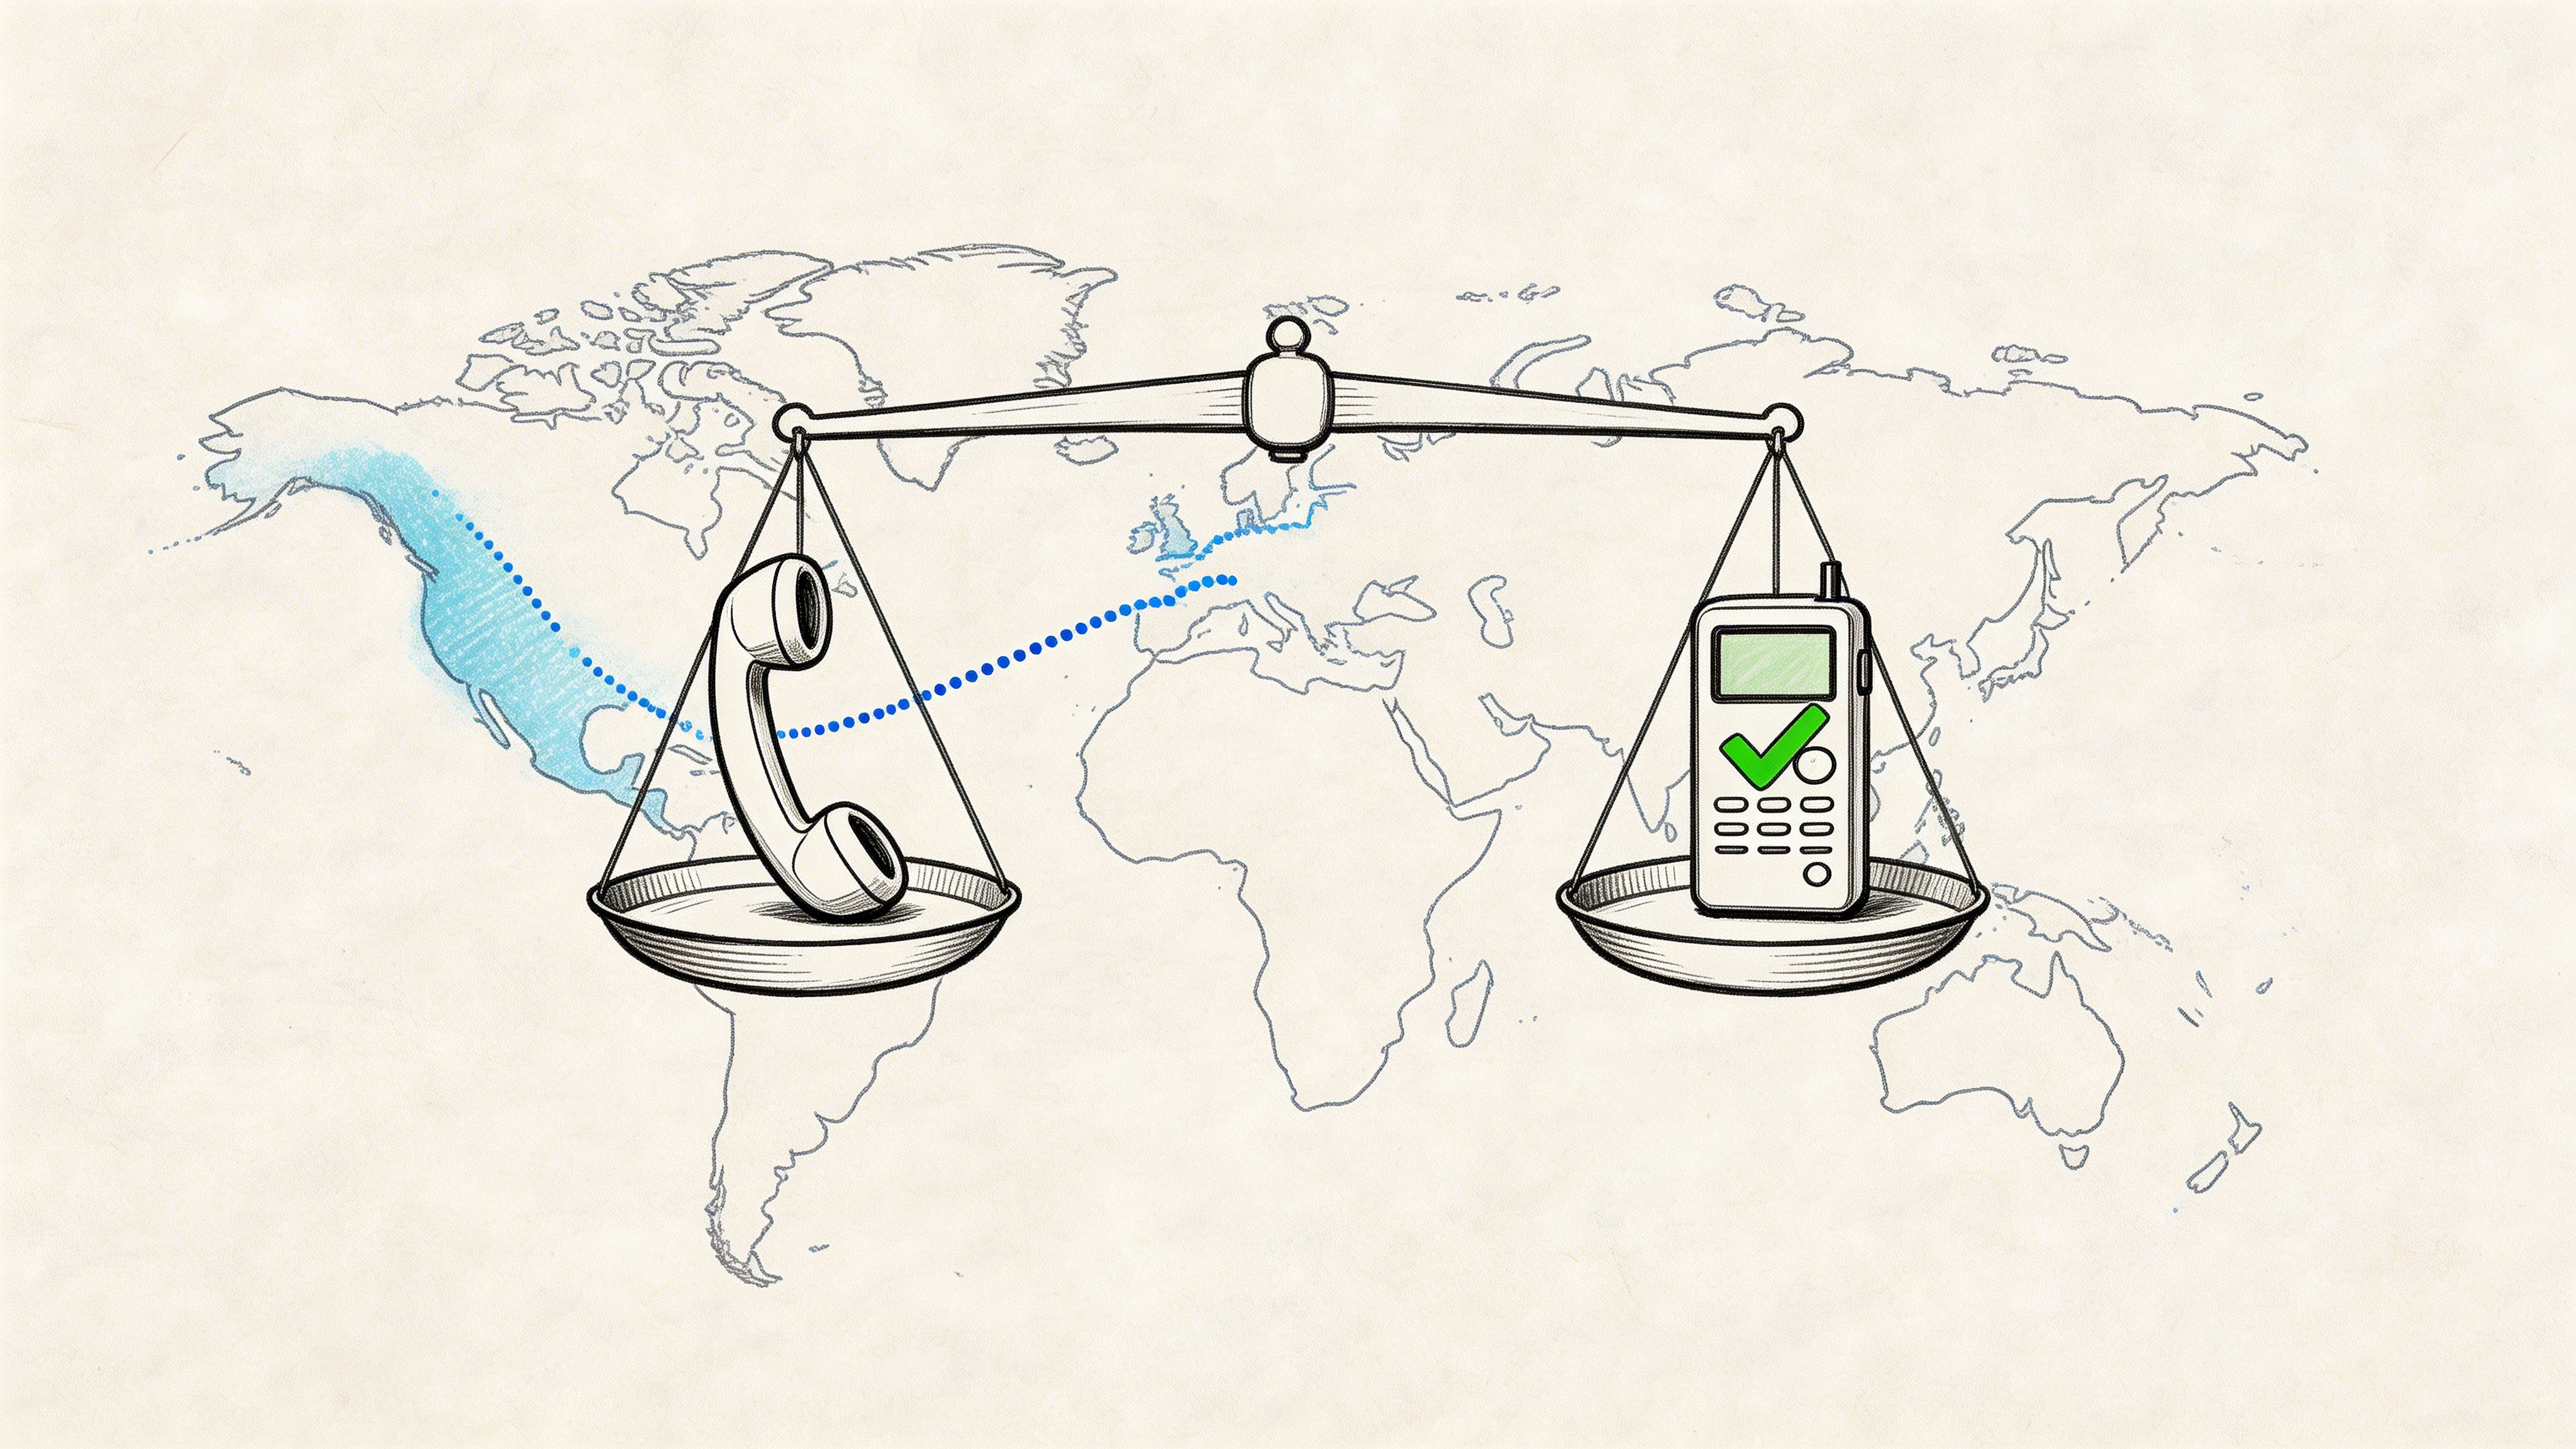
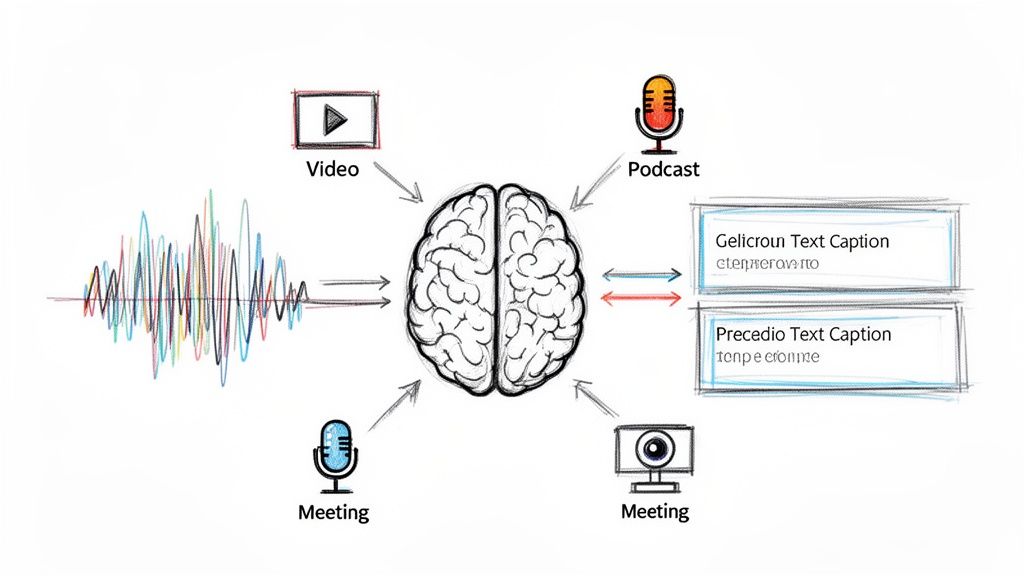
This screenshot shows the powerful model behind many of these tools, proving how well it performs even with challenging, real-world audio.
What this really means is that the tech is robust enough to handle the kind of messy audio we often get in qualitative research—background noise, overlapping speakers, and all. That ensures you're starting your analysis with high-quality, reliable data.
AI as an Enhancer, Not a Replacement
It's critical to see AI for what it is: a tool to augment your skills, not replace them. It automates the mechanical parts of the job, which frees up your mental bandwidth for what humans do best: interpretation, connecting dots, and uncovering the nuanced human stories hidden in the data.
AI handles the what—what was said, what words were used, what emotions were expressed. The researcher's job is to explain the so what—what it all means in a broader context.
This technology can operate at a scale and speed that's simply out of reach for any person. When you're dealing with massive volumes of text, looking into how AI sentiment analysis for customer feedback can pull out key trends is a massive advantage.
By weaving these tools into your workflow, you’re not just moving faster. You're creating more time and space for the creative, critical thinking that leads to truly meaningful discoveries. To see how the technology works under the hood, dive into our guide on AI-powered transcription services.
Your Top Qualitative Analysis Questions, Answered
As we've journeyed through the world of qualitative analysis, you've probably had a few practical questions pop into your head. That’s completely normal. This final section is dedicated to answering some of the most common things researchers wonder about when they're deep in the weeds of a project. Think of it as a quick troubleshooting guide to boost your confidence and keep you on track.
How Do I Know When I Have Enough Data?
This is the classic qualitative research question! The answer isn't a specific number of interviews, but a concept called thematic saturation. It's a bit different from quantitative work where you might have a set sample size from the start.
Here, you keep collecting data until you notice a clear pattern: you just aren't hearing anything new. When the last few interviews start to sound a lot like the ones you've already done, and you can almost predict what the next participant is going to say, you've likely hit saturation.
This is your cue that the data you have is probably robust enough to answer your research question. It's less about the quantity of participants and all about the quality and richness of the information you've gathered.
Can I Combine Different Analysis Methods?
Absolutely. In fact, doing so can give your findings a depth and nuance that a single method might miss. Using multiple methods is like looking at your data through different lenses—each one revealing a new layer of meaning. This approach is often called methodological triangulation.
For instance, you could kick things off with a broad Content Analysis to get a bird's-eye view, maybe counting how often certain keywords appear. Then, you could zoom in on a few key excerpts using Discourse Analysis to understand the social context and power dynamics behind why those words were used in the first place.
The trick is to be intentional. Don't just mix methods for the sake of it. Each approach needs a clear purpose, and together, they should build a more complete and convincing answer to your research question. Always be ready to explain why you made those specific methodological choices.
What Is the Difference Between a Code and a Theme?
This is a really common point of confusion, but the distinction is pretty straightforward once you get the hang of it. I like to think of codes as the individual Lego bricks and themes as the final structure you build with them.
A code is just a short, descriptive label you attach to a small chunk of data—a phrase, a sentence, maybe a short paragraph. It captures a single, basic idea. For example, if a participant says, "I just feel like I don't know my team on a personal level," you might apply the code "difficulty connecting with team." Codes are the first step in breaking down your raw data into manageable pieces.
A theme is the bigger-picture insight you develop after you’ve sorted and grouped your codes. It's a pattern that emerges from the data. You might take codes like "difficulty connecting," "feeling isolated," and "communication gaps" and realize they all point to a larger, interpretive theme: "Challenges of Remote Collaboration."
So, in a nutshell: codes help you organize the data, and themes help you create meaning from it.
Is Special Software Necessary for My Analysis?
The honest answer? It depends. While specialized software—tools like NVivo, ATLAS.ti, or Dedoose—can be a huge help, it's not always a must-have.
For smaller projects with just a handful of interviews, you can get the job done perfectly well with tools you already know, like a good word processor or a spreadsheet. But as your project scales up, that's when dedicated software, often called CAQDAS (Computer-Assisted Qualitative Data Analysis Software), really shines. It’s fantastic for organizing hundreds of pages of text, ensuring you apply codes consistently, and visualizing the relationships between your themes.
Just remember that the software is only a tool. It organizes, but it doesn't think. Your brain will always be the most important instrument in your analysis toolkit. The software is there to handle the administrative heavy lifting, making your process faster, more transparent, and a lot less overwhelming.
Ready to eliminate the most time-consuming part of your qualitative research? Whisper AI transcribes your interviews, focus groups, and audio notes in minutes with stunning accuracy. Stop wrestling with manual transcription and start your analysis faster. Try Whisper AI for free today!