How to Analyze Interview Data: A Step-by-Step Guide
You’ve finished your interviews. The hard part is over, right? Not quite. Now, you’re sitting on a collection of audio files, and the real challenge begins: turning those conversations into clear, actionable insights. This process, from messy audio to a compelling final report, demands a structured approach. It starts with meticulous transcription, requires smart data organization, and is grounded in an unwavering commitment to ethical standards like participant privacy. Getting this foundation right is non-negotiable—it saves you from a world of headaches later and ensures your insights are built on solid ground.
Laying the Groundwork for Analysis
Before you can even think about spotting themes or drawing conclusions, your raw interview recordings have to be wrangled into a workable dataset. From my experience, this is the most critical phase of the entire process. If you rush it, it’s like trying to build a house on a shaky foundation; the whole structure is at risk. A well-organized, ethically handled dataset makes everything that follows—coding, theme development, reporting—so much smoother and more credible.
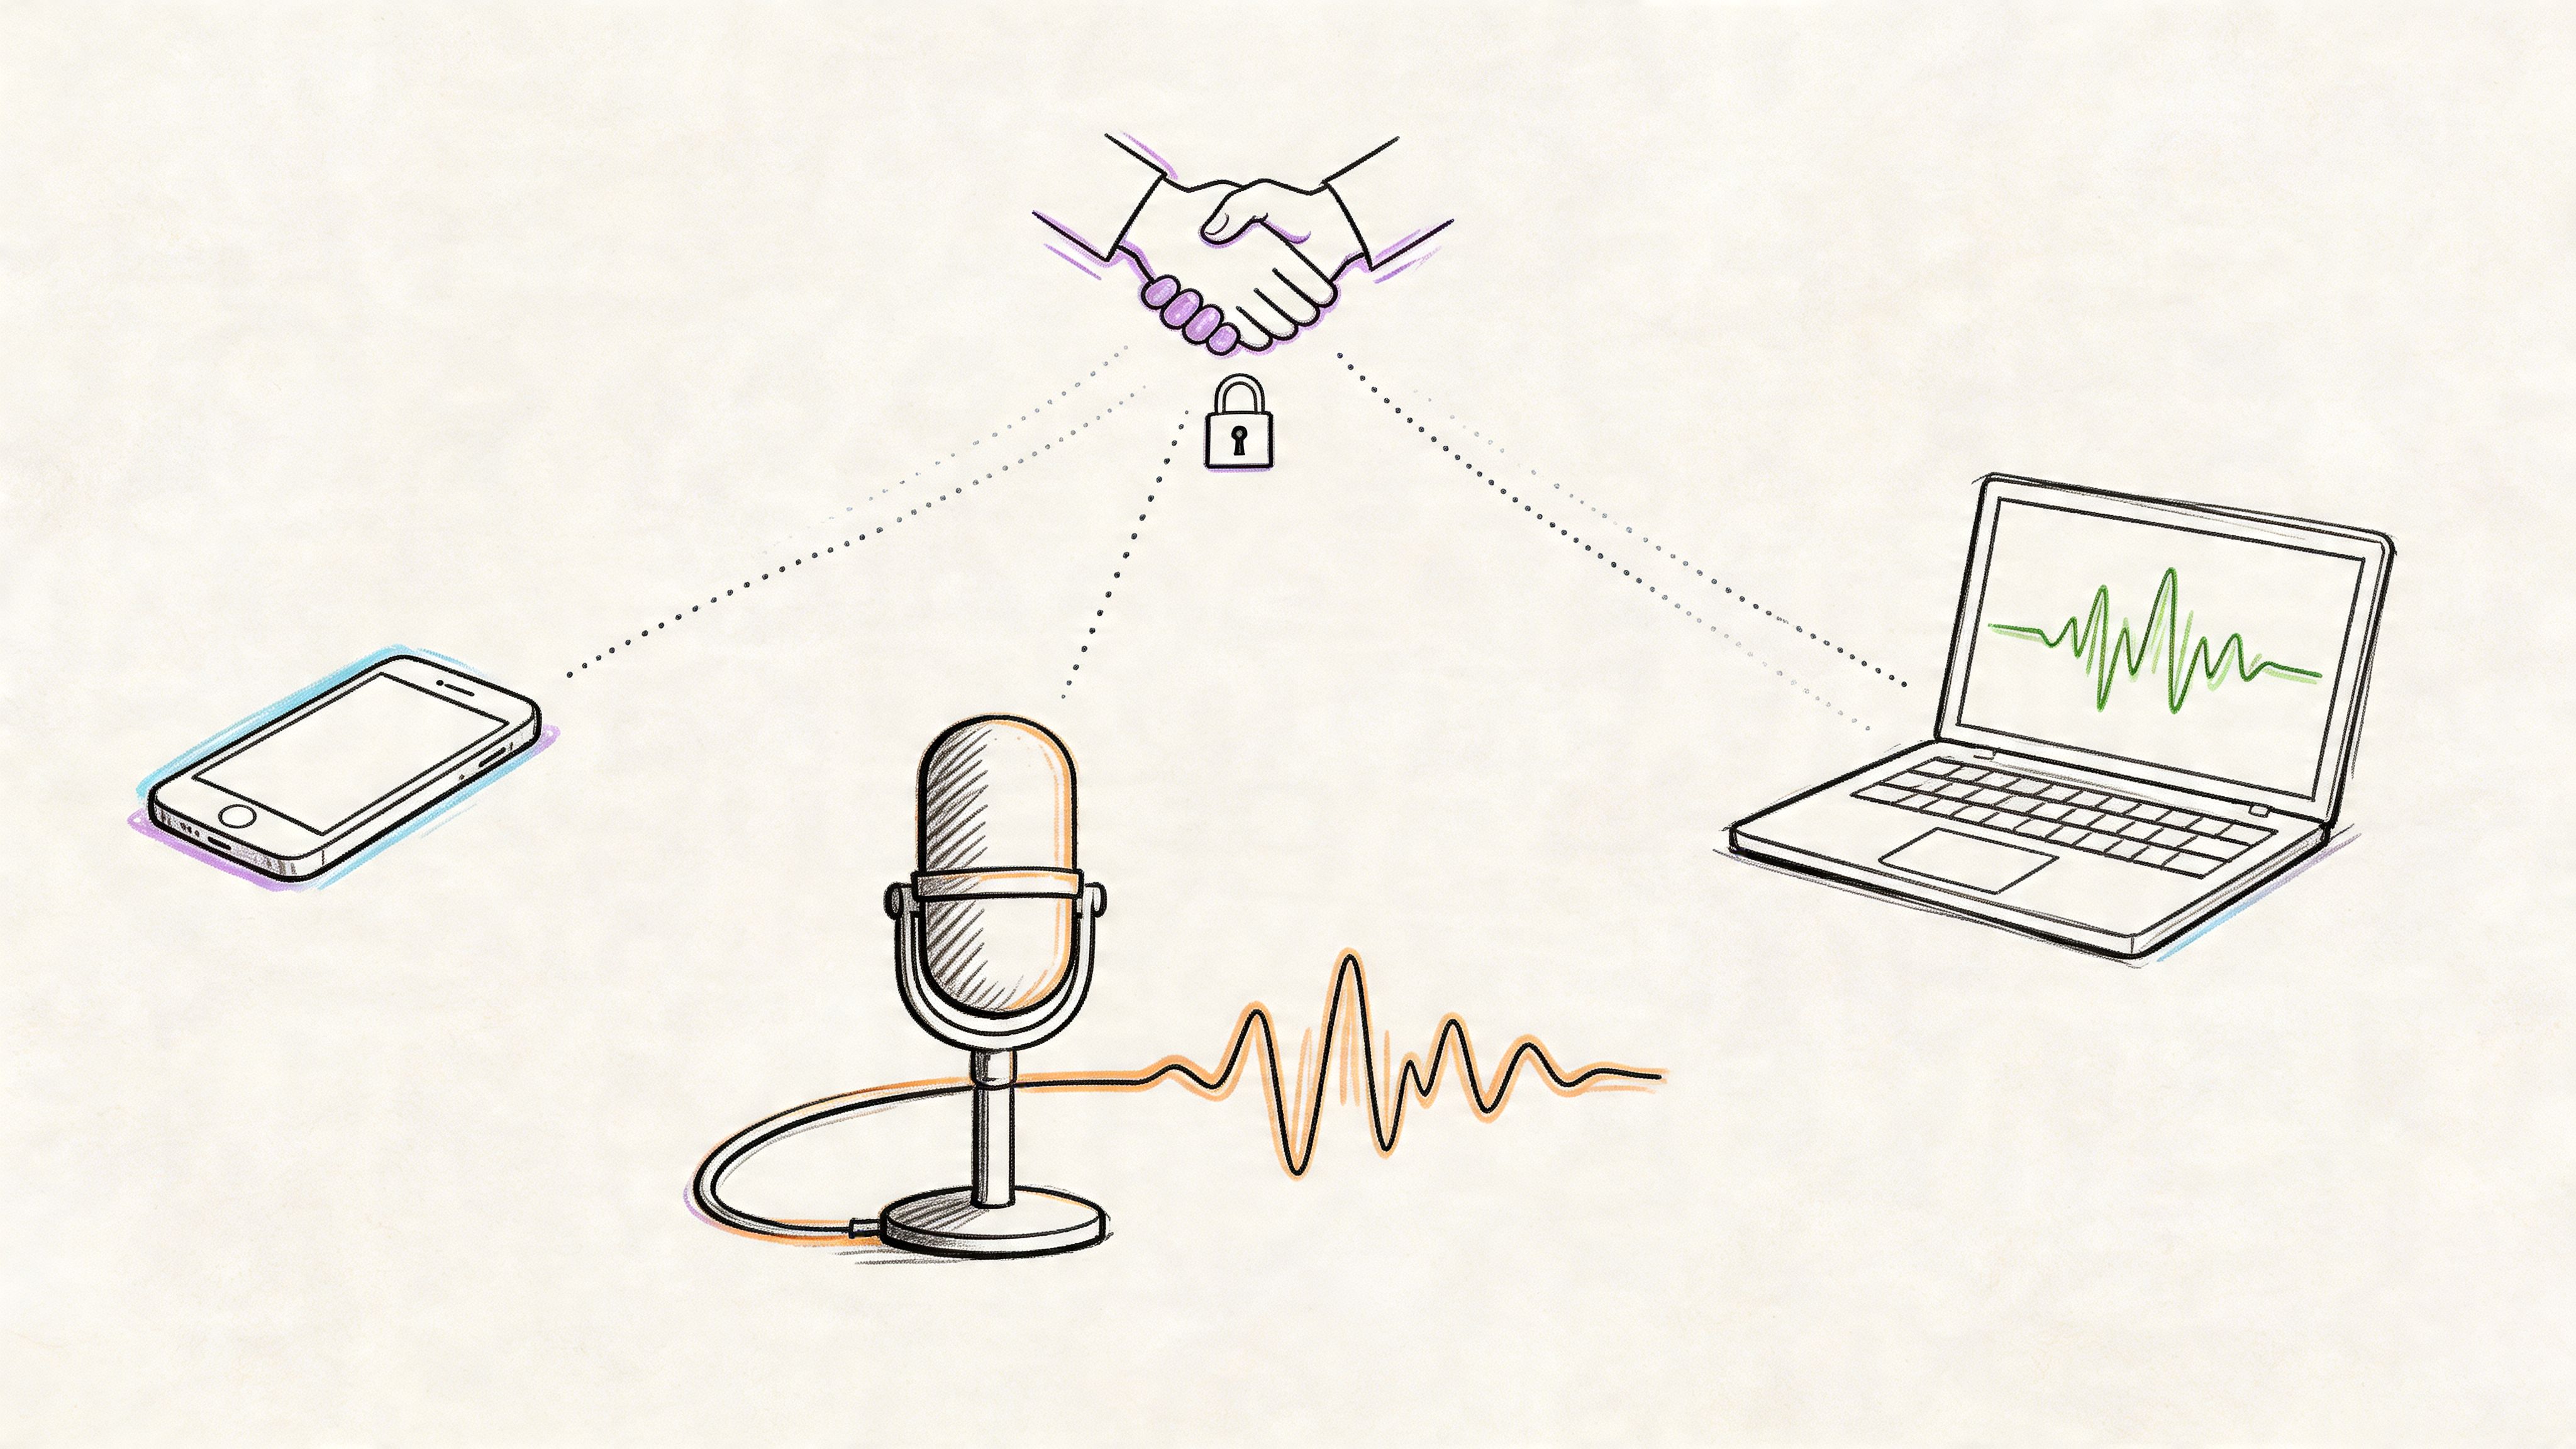
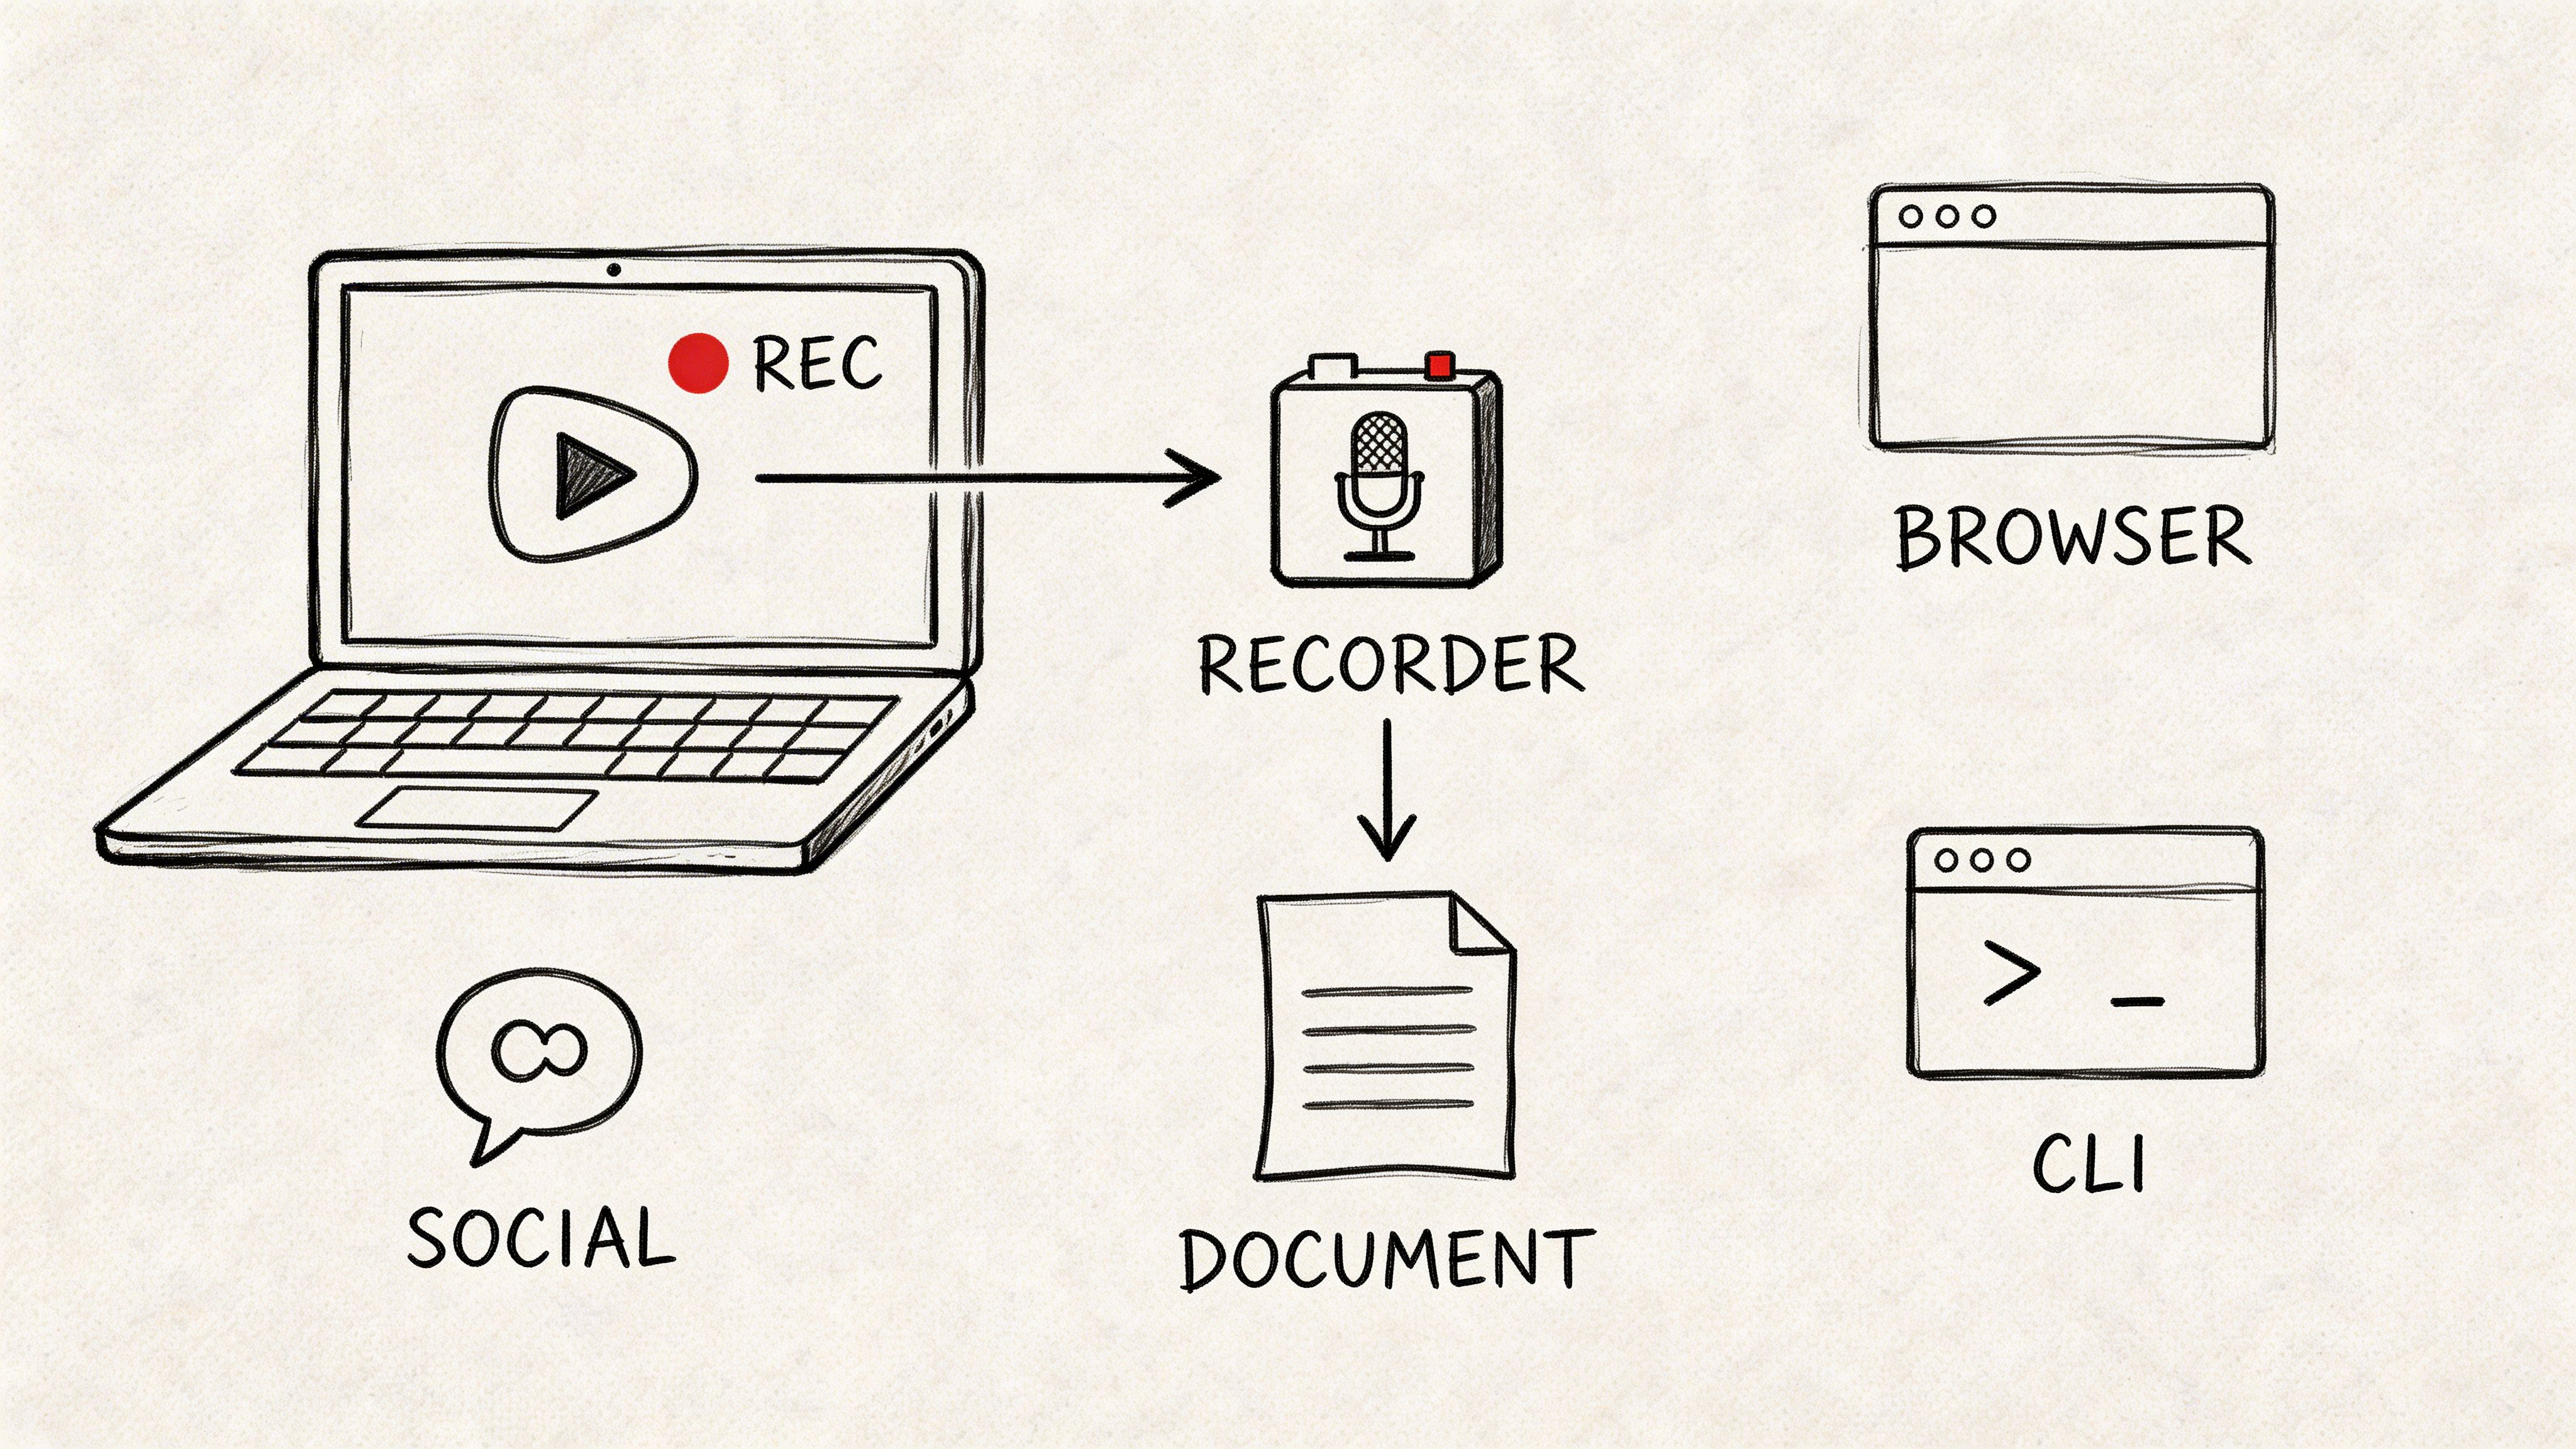
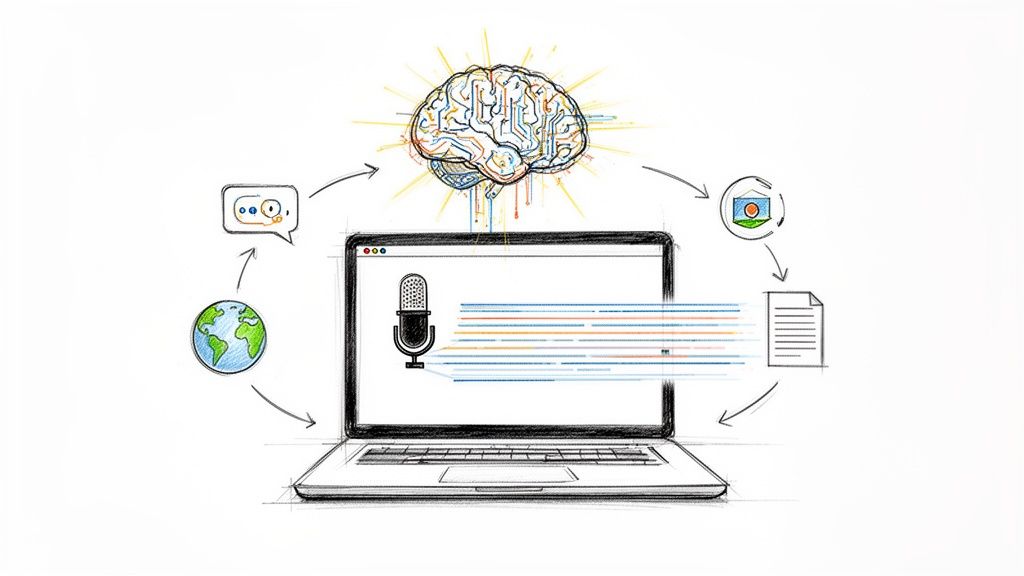
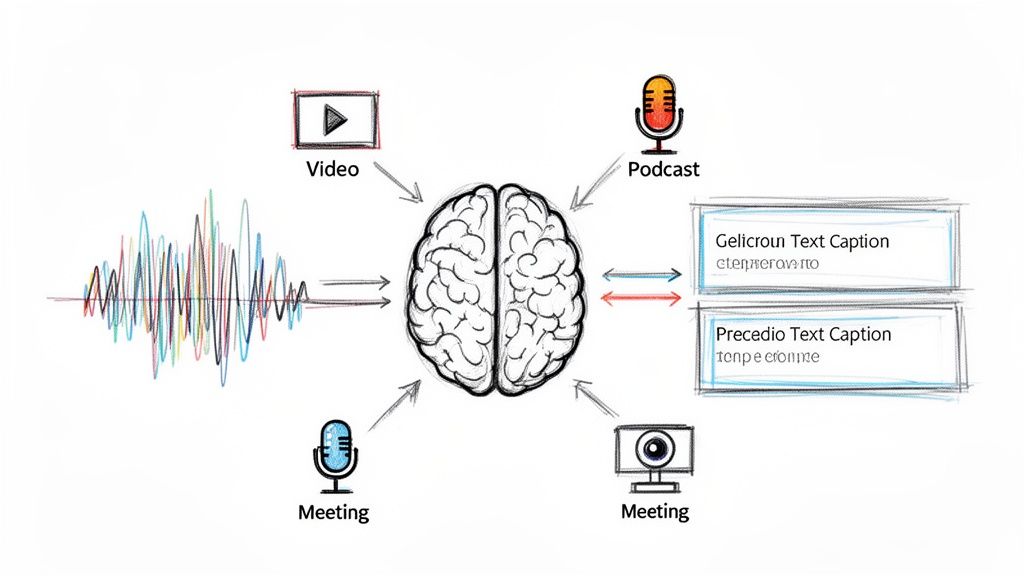
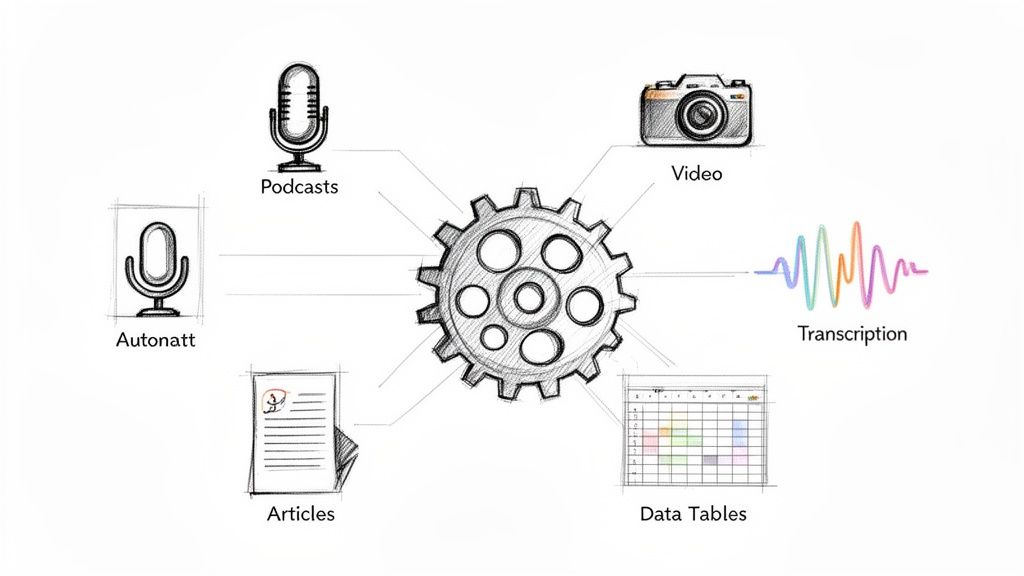
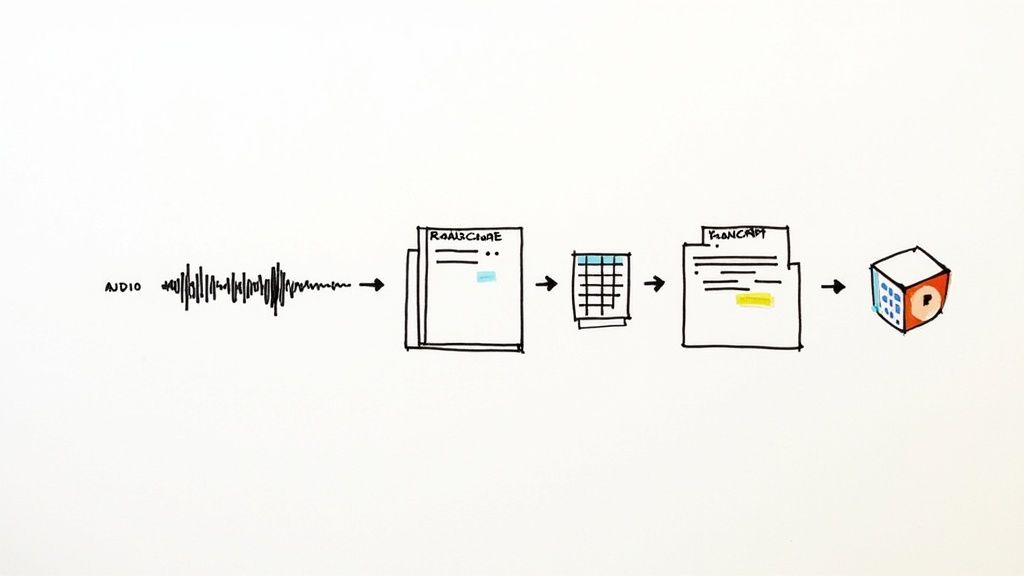
The journey from a folder of .mp3 files to an analysis-ready dataset really boils down to three key activities: transcription, organization, and anonymization. Each one sets you up for the next.
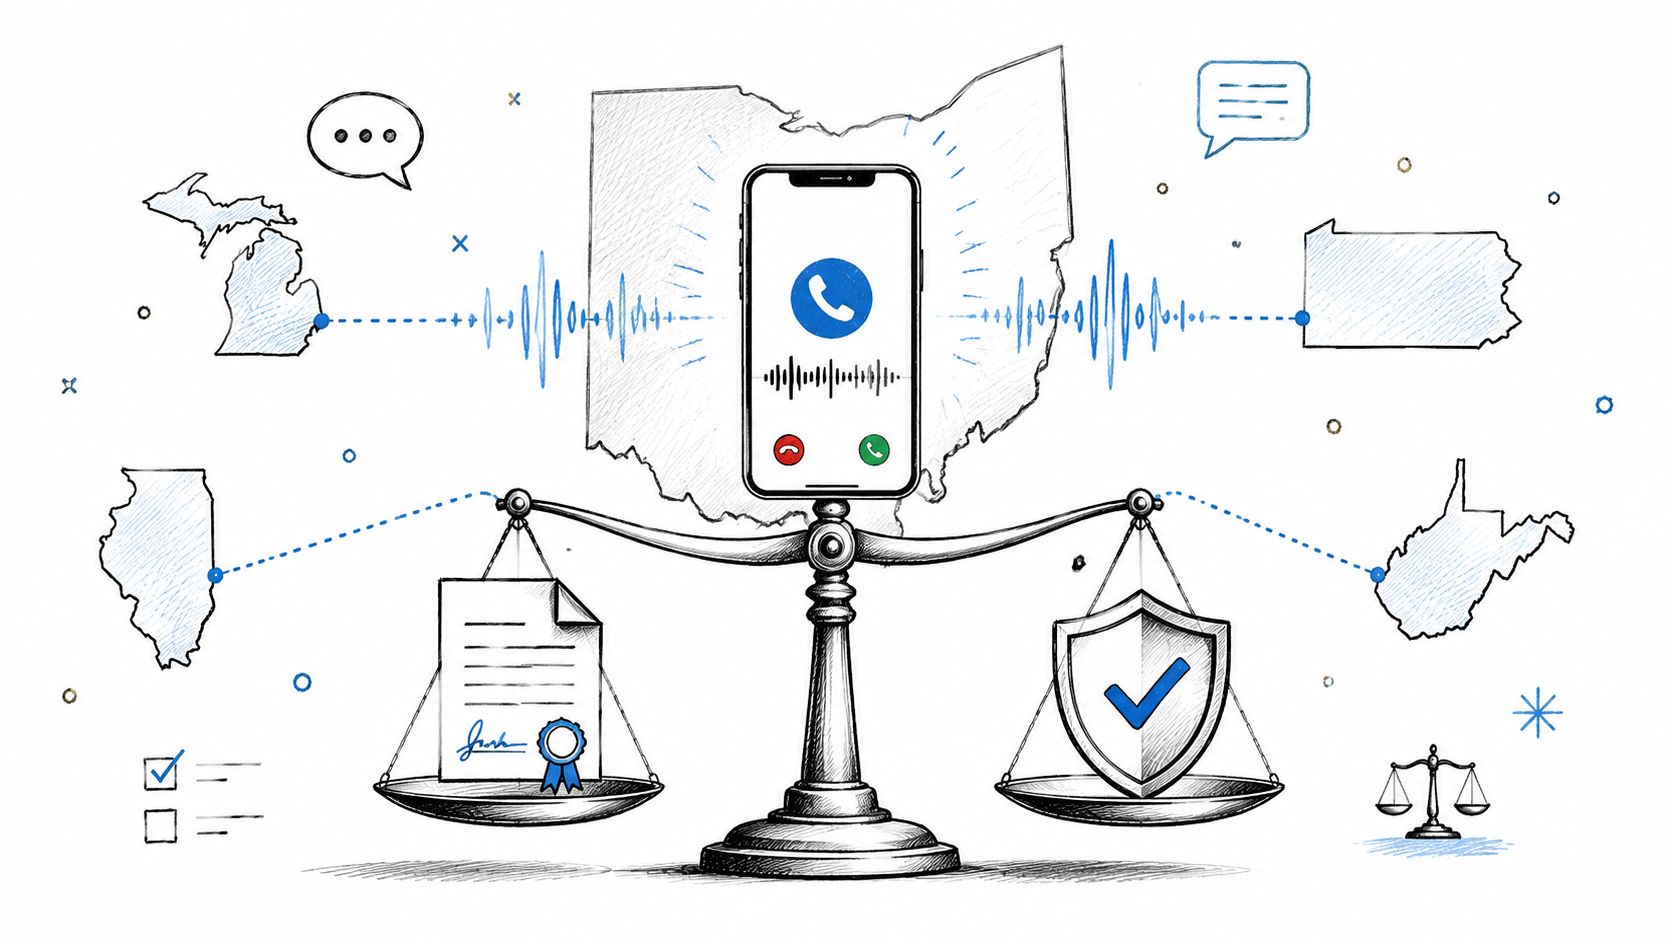
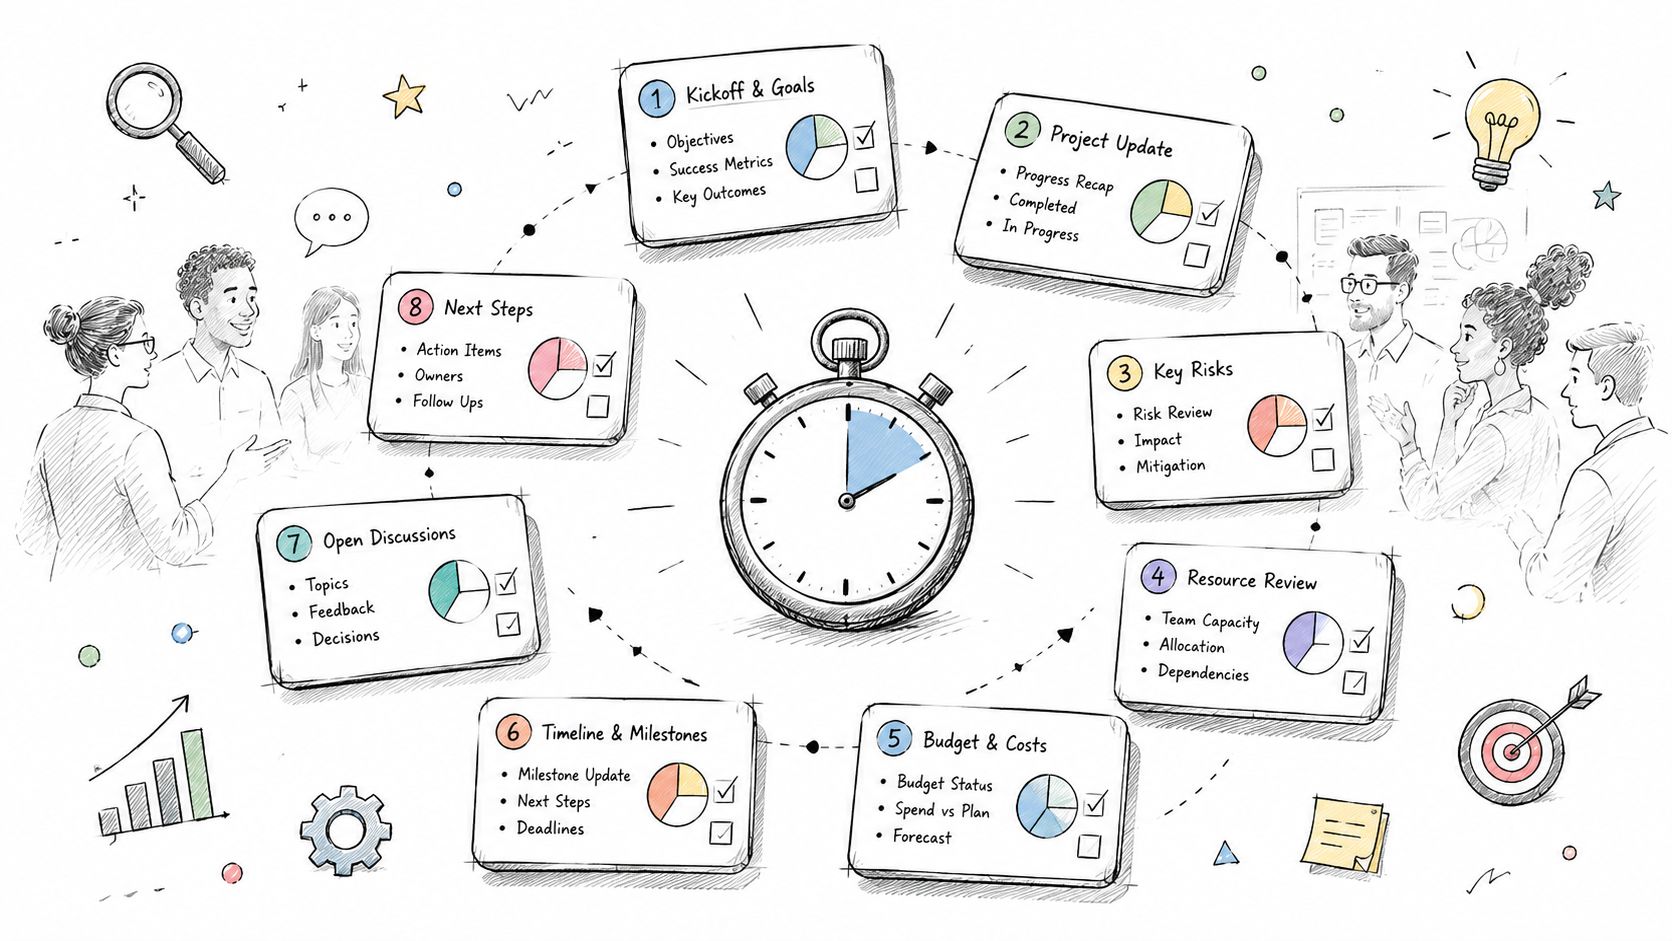
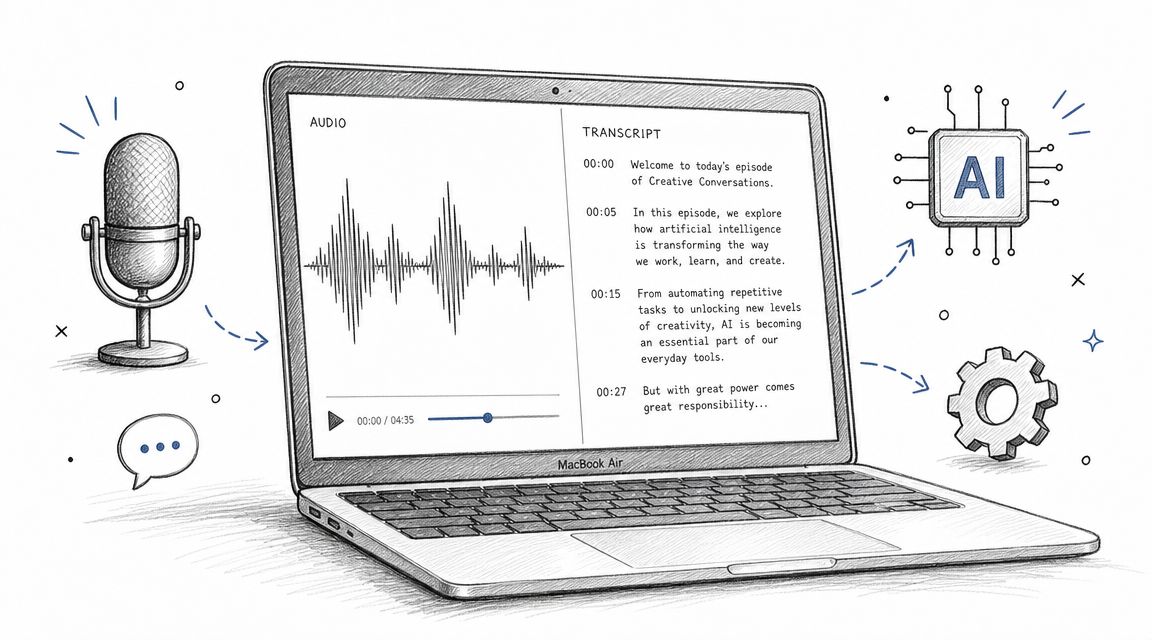
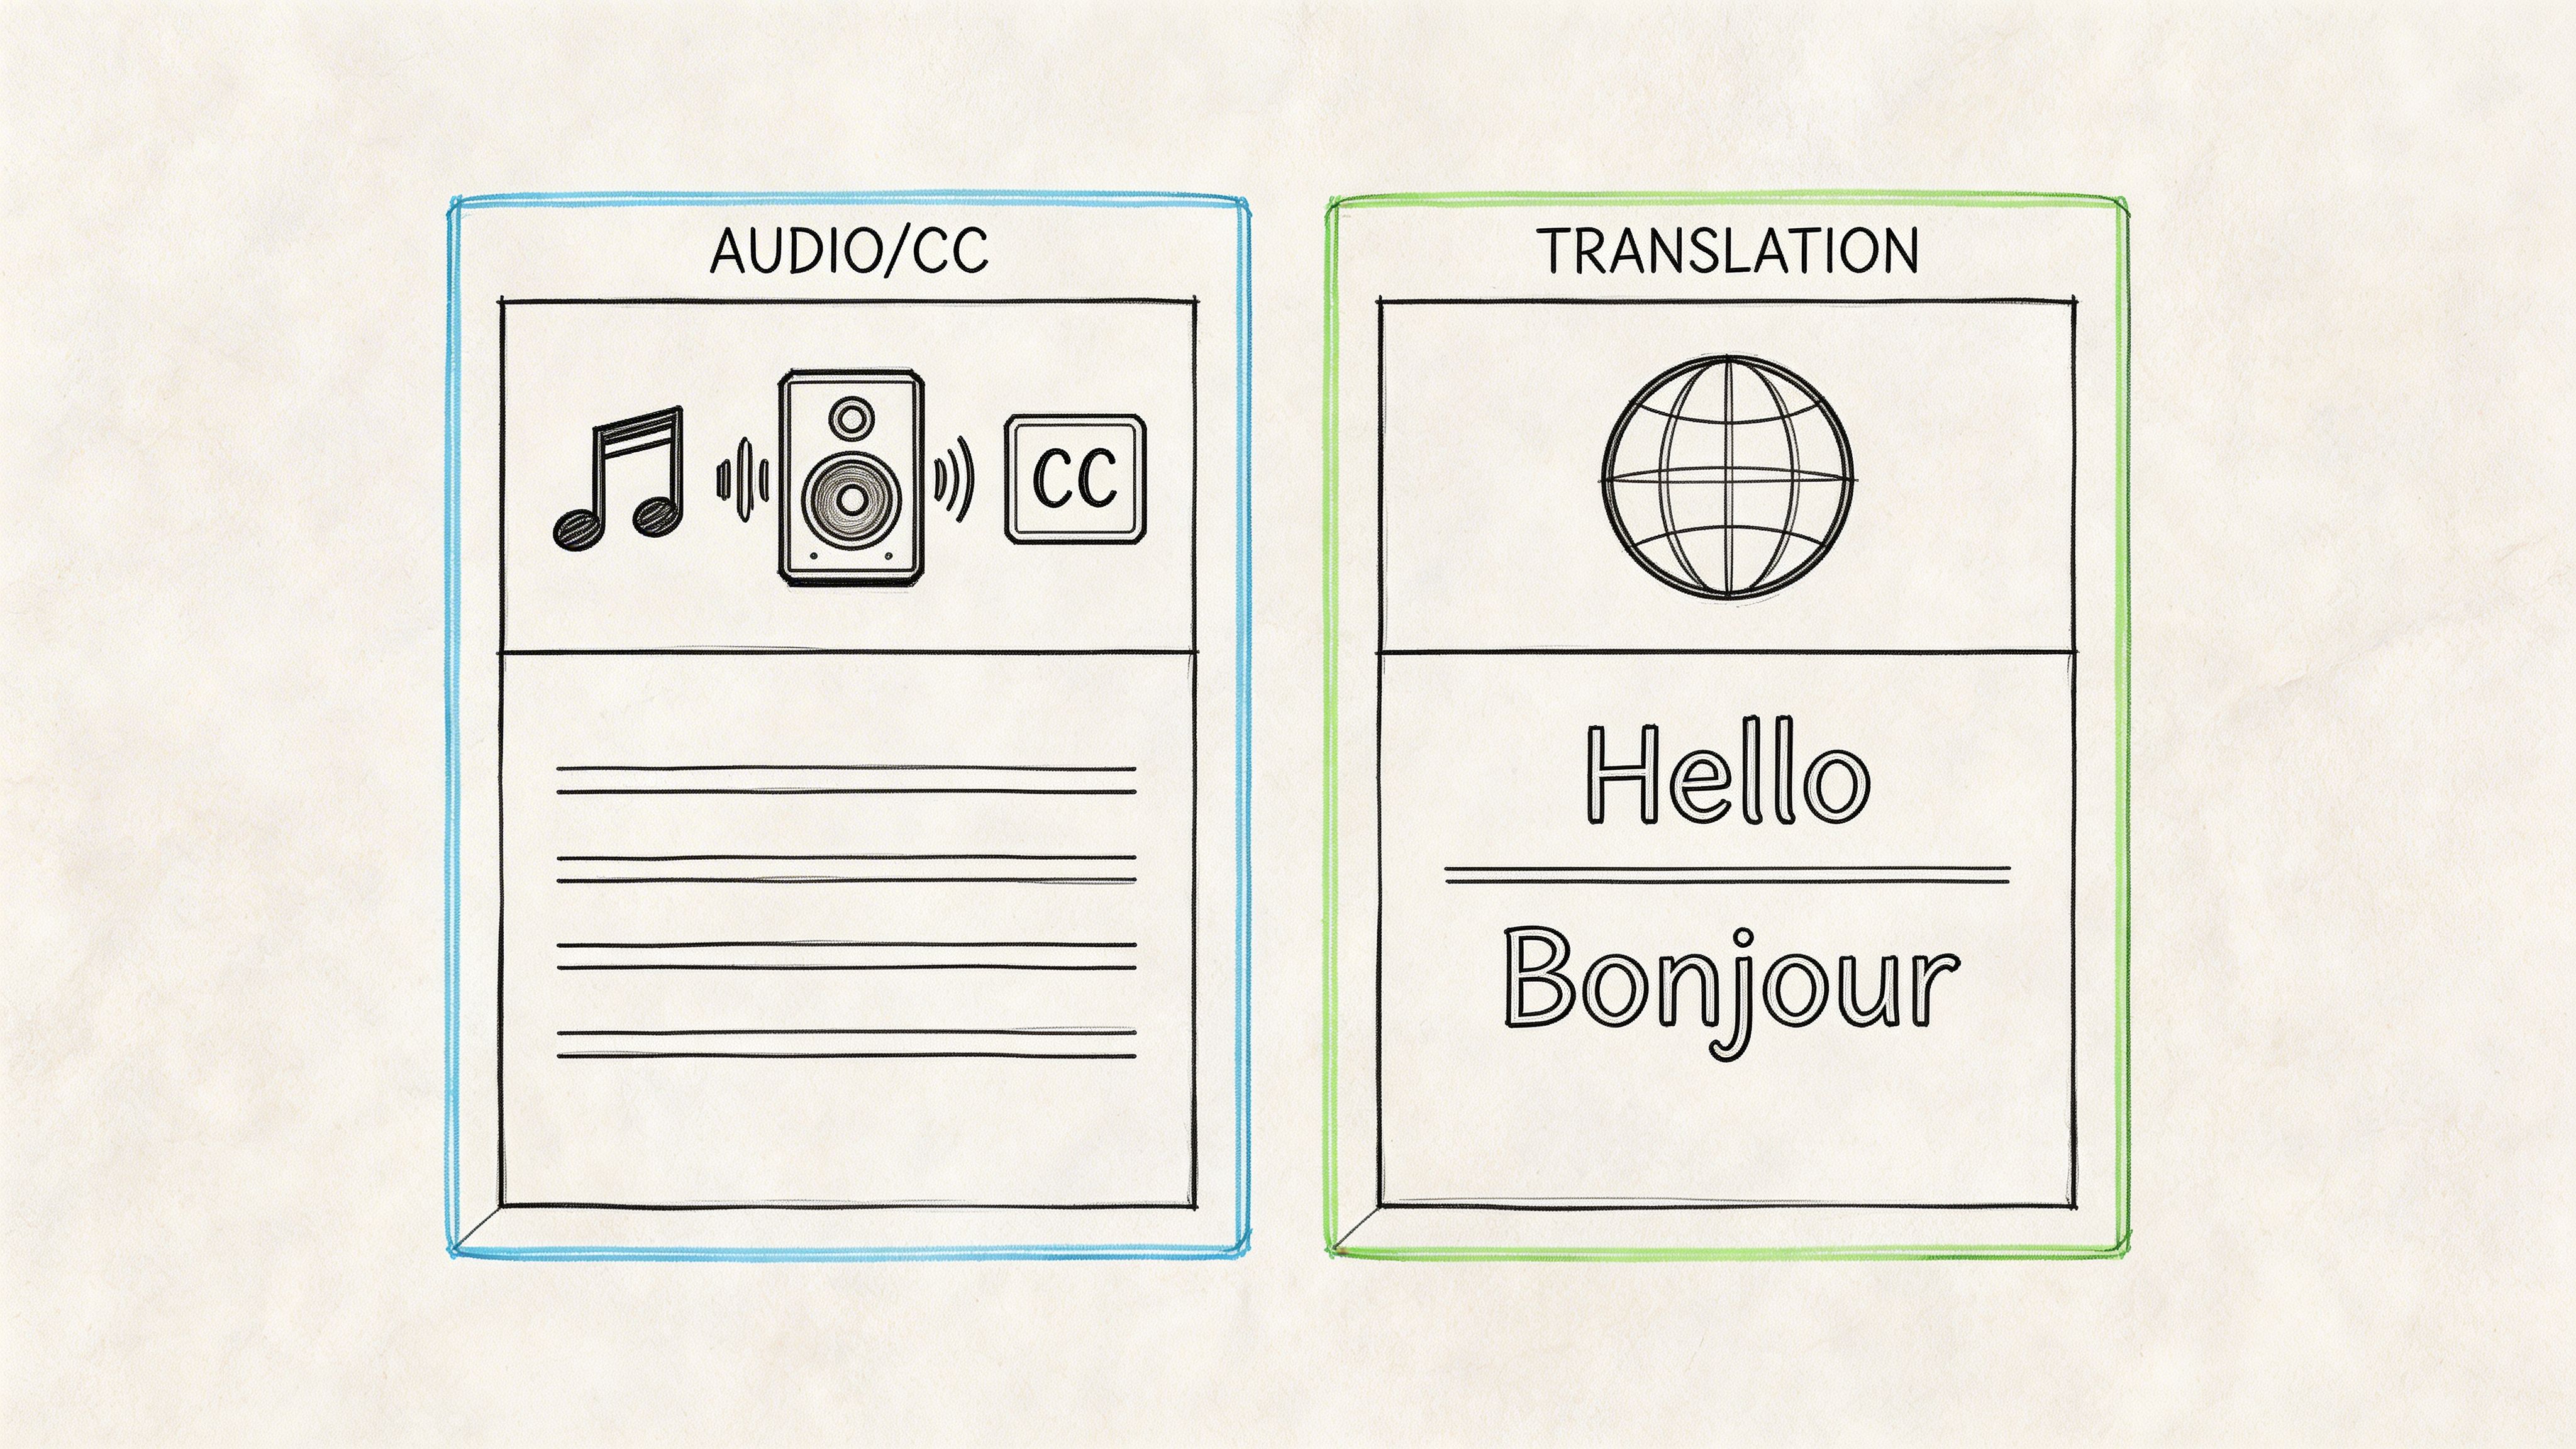
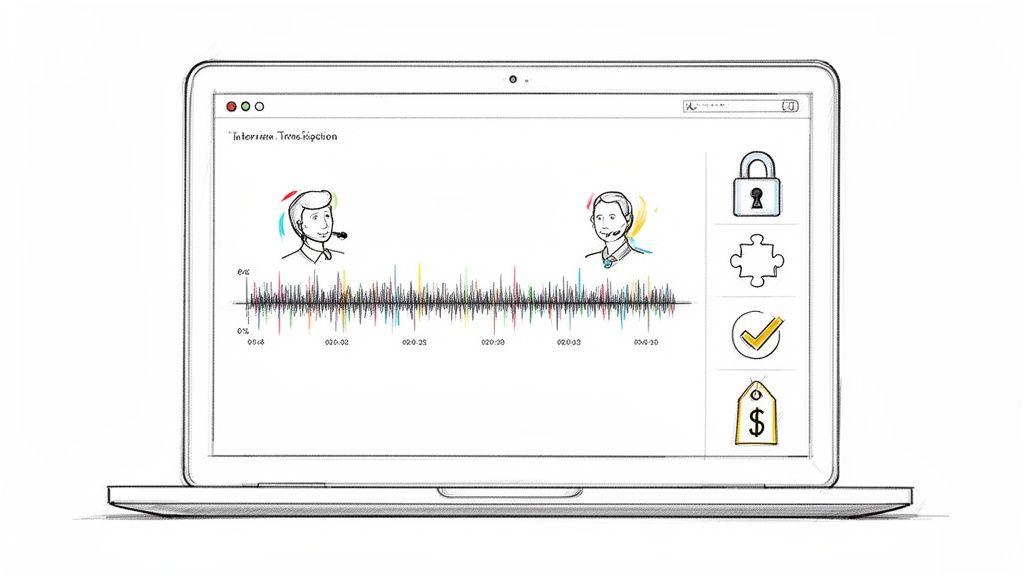
This visual flow shows how you move from raw audio to a secure, organized text format, ready for the real analysis to begin.

As you can see, the real work starts long before you're highlighting text and creating codes. It begins with the fundamental tasks of recording, transcribing, and protecting the identities of the people who trusted you with their stories.
Choosing Your Transcription Method
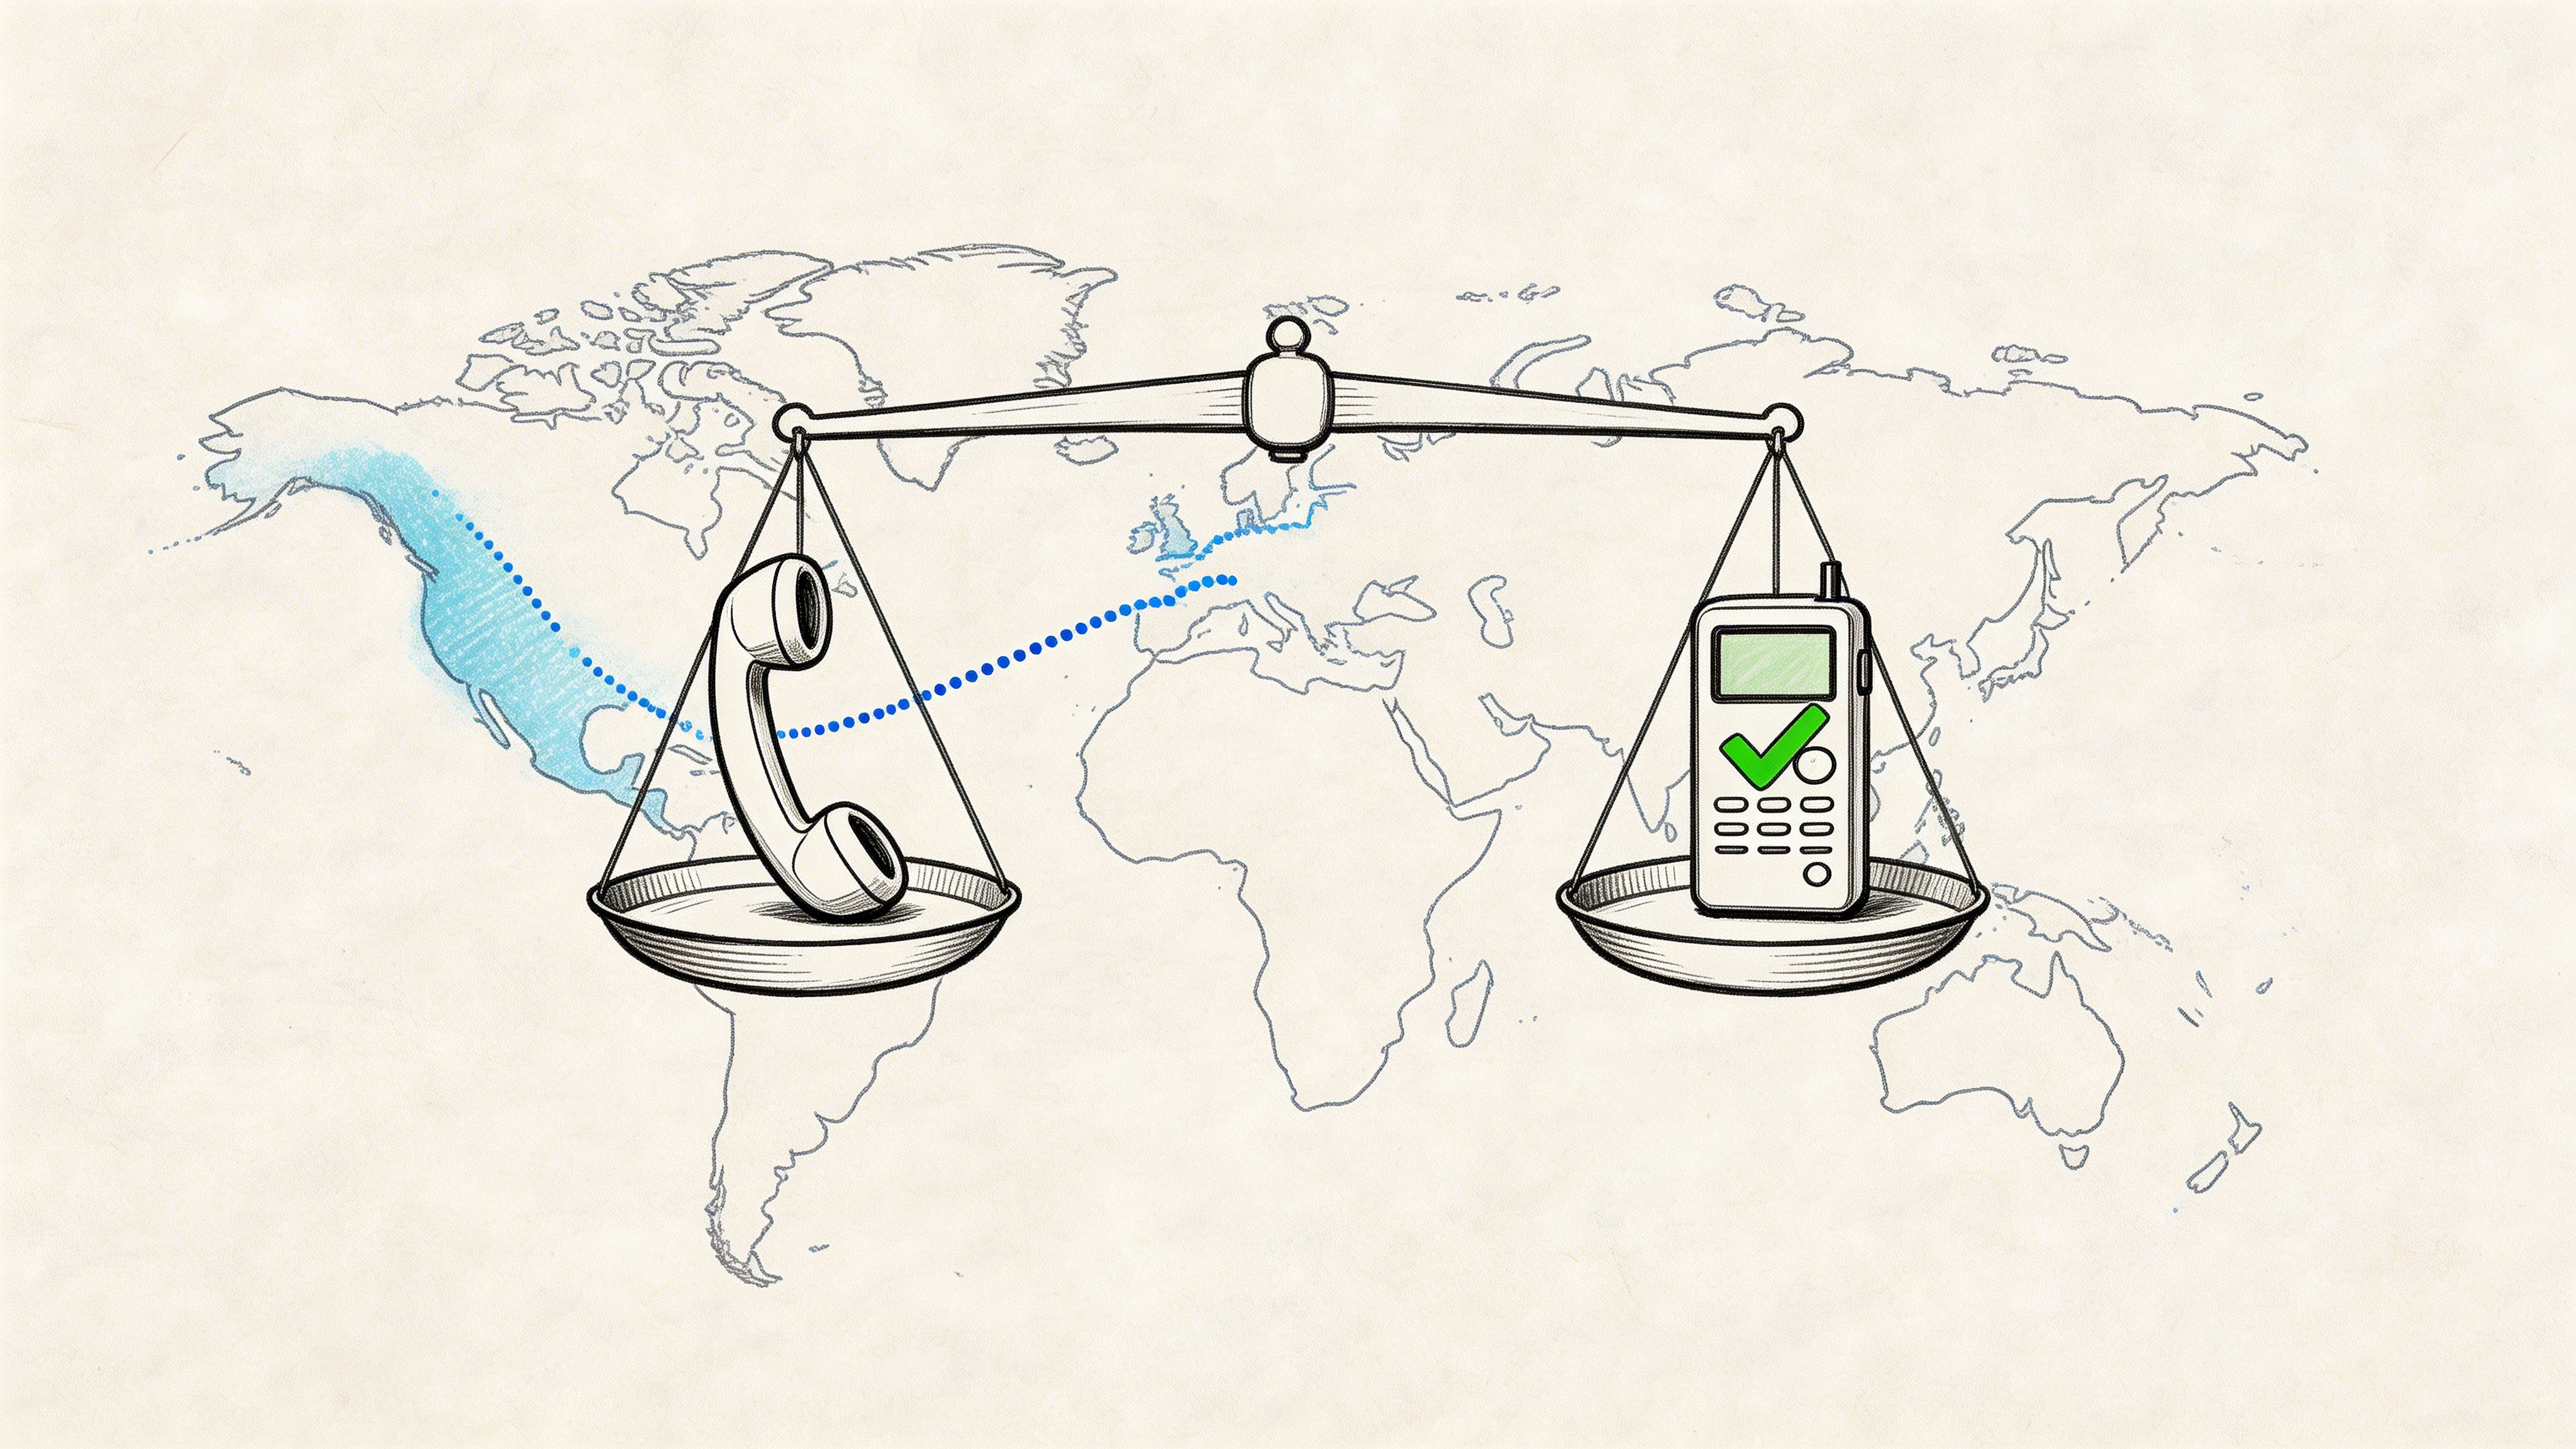
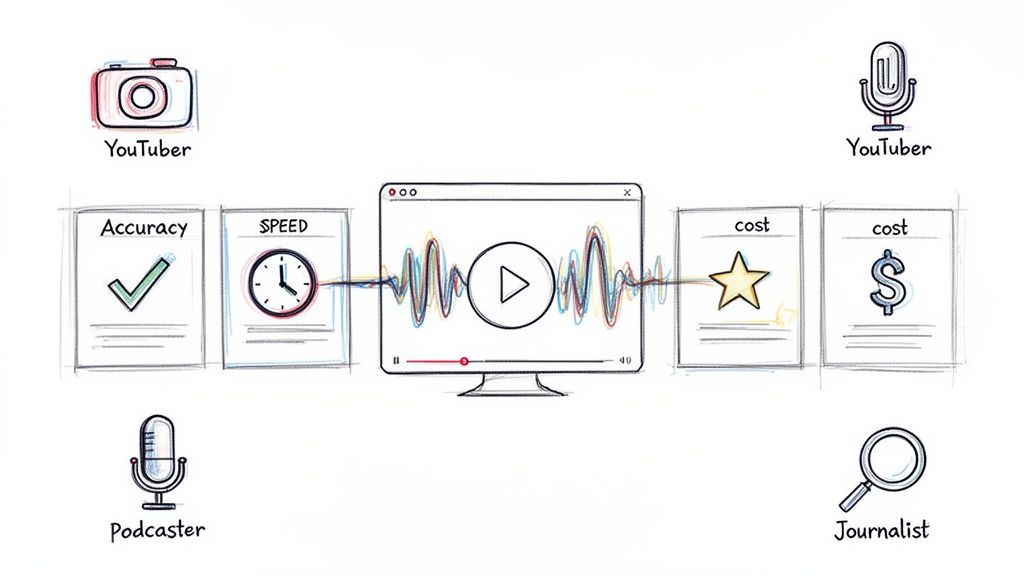
Your first big decision is how to get those spoken words into text. You've got two main options: doing it manually or using an AI-powered tool. There's no single "best" choice here; it really depends on your project's budget, timeline, and how much nuance you need to capture.
Making the right choice between manual and AI-assisted transcription is a balancing act. You have to weigh the need for speed and cost-effectiveness against the demand for perfect accuracy and the capture of subtle conversational cues. This table breaks down the key differences to help you decide.
For many researchers, a hybrid approach is the sweet spot. Let an AI tool do the initial heavy lifting to get a draft done quickly. Then, a human can listen back to the audio, cleaning up errors, correcting speaker labels, and adding in those crucial contextual notes. This gives you the speed of automation with the precision of a human touch. If you want to dive deeper, we have a complete guide on how to transcribe interviews using modern tools.
Organizing Your Data for Clarity
Once the transcripts are ready, organization is everything. A messy folder of documents will bring your analysis to a screeching halt. The trick is to establish a clear and consistent system from day one.
A simple but effective strategy is to create one master folder for the project. Inside that, make subfolders for your different data types: one for the original audio recordings, another for the raw transcripts, and a third for the final, anonymized versions you'll actually analyze. A logical file-naming convention is just as important. For instance: ProjectName_ParticipantID_Date.docx (e.g., ExitInterview_P07_2024-10-26.docx).
Pro Tip: I always keep a separate "project log" in a simple spreadsheet. I use it to track the status of each interview—recorded, transcribed, anonymized, coded. It gives me a bird's-eye view of my progress and makes sure nothing falls through the cracks.
Protecting Participant Privacy
In any kind of qualitative research, your ethical responsibility is paramount. Before you start analyzing a single word, you must anonymize your data to protect participant confidentiality. This means systematically removing or changing any personally identifiable information (PII) in your transcripts.
Look for and remove details like:
- Names of people
- Company or department names
- Specific cities or locations
- Job titles that could be easily traced
- Any other unique detail that could point back to a person
Just swap these identifiers with generic placeholders, like "[Manager's Name]" or "[Previous Company]." This isn't just about ticking a box for an ethics board; it's a fundamental part of building trust and respecting the people who shared their experiences with you. With a clean, organized, and ethically prepared dataset, you're finally at the true starting line for your analysis.
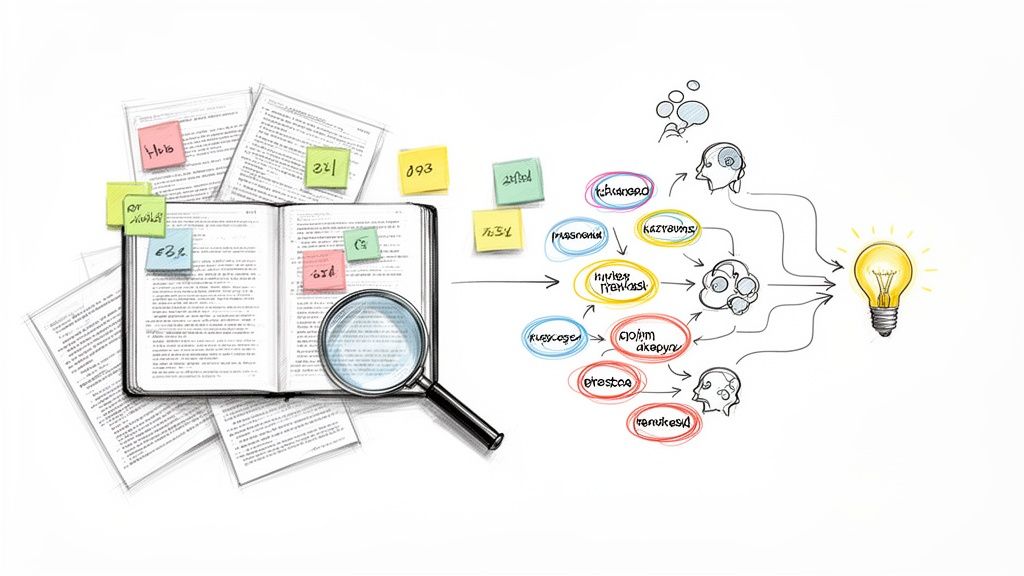
Finding Meaning with Inductive and Deductive Coding
With clean transcripts in hand, the real detective work can finally begin. This is the moment you stop looking at pages of text and start uncovering the stories hidden within. The process is called coding, which is really just a systematic way of tagging or labeling sections of your data to pull out key ideas and patterns. It’s how you start to make sense of all the noise.
You can tackle this in two main ways. Think of it as choosing between letting the data be your guide (inductive) or starting the journey with a map already in your hand (deductive).
The Inductive Approach: Letting Themes Emerge from the Ground Up
Inductive coding is a "bottom-up" approach where you dive into the data without any preconceived notions or a ready-made list of codes. You read through your transcripts line by line, creating labels based on what you’re actually seeing. Picture yourself as an explorer charting new territory—the whole point is that you don’t know what you’ll find.
This method is perfect for exploratory research when you're trying to understand a situation without forcing your own biases or existing theories onto it.
Let's say you're analyzing exit interviews to figure out why people are really leaving the company. With an inductive approach, you might start highlighting phrases and creating codes like:
- "Frustrated with project delays"
- "Felt my manager never gave recognition"
- "Felt isolated working from home"
- "No clear path for skill growth"
As you work through more interviews, you’ll start to group, refine, and connect these codes. The most powerful insights often come from patterns that emerge organically from what people said, not from what you expected to hear.
The Deductive Approach: Using a Predefined Framework
On the other side is deductive coding, a "top-down" strategy. Here, you start with a set of codes you’ve already created, often drawn from your research questions, an existing industry framework, or specific topics you absolutely need to investigate. You then scan the transcripts specifically for content that fits these predefined categories.
This approach is far more structured and works best when you need to test a hypothesis or get answers to very specific questions.
Sticking with our exit interview example, a deductive codebook might be built before you even read the first transcript:
- Compensation: Any mention of salary, bonuses, or benefits.
- Work-Life Balance: Comments about hours, flexibility, or burnout.
- Management Style: Feedback on direct supervisors or leadership.
- Career Progression: Discussion of promotions or growth opportunities.
Your job becomes searching for evidence that fits into these established buckets.
My Take: Neither approach is better; they just have different jobs. Inductive is for discovery, and deductive is for validation. Honestly, many of the best projects I've worked on used a hybrid model—starting with a few key deductive codes but staying open to creating new inductive ones as surprising ideas pop up.
Why Your Codebook Is Your Most Important Tool
No matter which path you take, you need to build a codebook. This is your central reference guide, a document that lists every code, its definition, and a clear example of how to apply it. A solid codebook is what ensures your analysis is consistent and reliable, especially if you have multiple people working on the data.
This kind of structured analysis is becoming essential in areas like talent acquisition, where minimizing bias is a huge priority. In fact, 72% of companies now use structured interviews (asking every candidate the same questions) for this very reason. Research has shown that this structured approach is far better at predicting job performance, with a validity coefficient of 0.51 compared to just 0.38 for unstructured chats.
A clear coding process does for your data what a structured interview does for hiring—it ensures you evaluate everything fairly. As you get deeper, it can be helpful to brush up on general methods for analyzing qualitative data to keep your thinking sharp. This foundational step of coding is what turns raw text into structured insights, setting the stage for the next phase: connecting these codes into powerful, overarching themes.
From Codes to Compelling Themes: Finding the Story in Your Data
You’ve spent hours coding your interviews. Your transcripts are a sea of highlights and labels. This is a massive step forward, but let's be clear: a list of codes isn't the finish line. The real insight—the "aha!" moment—comes from connecting those individual codes into a cohesive story.
Think of it this way: your codes are the individual bricks. They're essential, but you can't build a house with a pile of bricks. You need to arrange them, add mortar, and construct something meaningful. This next phase is all about moving from the granular details of your codes to the big-picture understanding of your themes.
Starting with Clusters: From Codes to Categories
The first thing to do is to find relationships between your codes. I like to spread them all out, either physically with sticky notes on a wall or digitally on a Miro board. Just get them all in one place where you can see them. Now, start grouping the codes that feel like they belong together.
This part feels more like art than science at first. You’re just looking for patterns, for concepts that cluster together.
Let’s say you just finished a round of user research interviews. Your initial codes might look something like this:
- "Confused by the checkout button"
- "Couldn't find the search bar"
- "Annoyed by all the pop-ups"
- "The page took forever to load"
- "Wished there were more product filters"
As you group them, you'll start to see broader categories emerge. For instance, you might create a bucket called "Navigation Issues" for the checkout button and search bar codes, and another called "Poor Site Experience" for the pop-ups and slow loading times. These categories are a crucial middle step, helping you bring some order to the chaos of dozens, or even hundreds, of individual codes.
Developing and Defining Your Themes
With your initial categories in hand, the real work begins: refining them into solid themes. A theme is so much more than a simple summary; it's an interpretive statement that captures a significant, recurring idea across your entire dataset. It tells a crucial part of the story your data is trying to communicate.
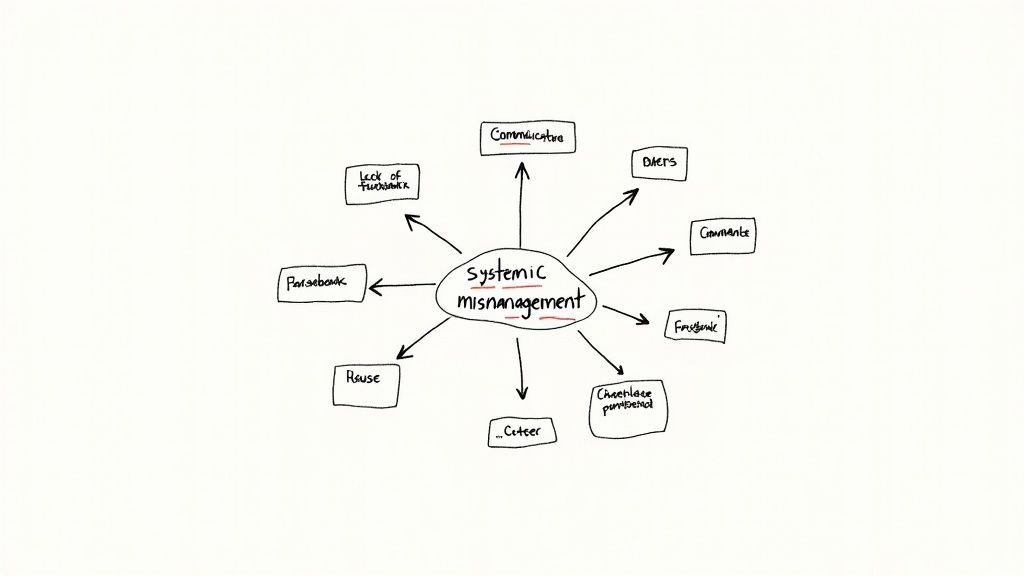
Let's switch gears to an employee exit interview project. You might have codes like "communication delays," "never got any feedback," and "project goals were always unclear." It’s tempting to group these and just call the theme "Communication Problems."
But a truly powerful theme digs deeper. As you re-read the quotes attached to those codes, you might realize the problem isn't just a few missed emails. It’s a systemic breakdown. You could refine that theme into something far more specific and actionable, like "Systemic Project Mismanagement Undermines Employee Morale." Now that tells a story and points directly to a root cause.
A strong theme isn't just a topic; it's an argument. It makes a claim about your data that you can back up with direct evidence (the quotes!) from your interviews. This is how you transform simple observations into insights that drive action.
Defining your themes is almost never a one-and-done process. It’s messy and iterative. Expect to move back and forth between your coded data, your categories, and your draft themes.
- Merge: You’ll probably find that two of your early themes are so intertwined they should be combined into a single, more powerful one.
- Split: On the flip side, you might have a theme that feels too broad and clunky. Don't hesitate to break it apart into smaller, more focused sub-themes.
- Revisit: As you get closer to the story, you might even need to pop back into your original coding to make sure it still aligns with the themes you're developing.
This constant refinement is just part of the deal with qualitative analysis. Your first ideas are rarely your best ones. The goal is to build a thematic structure that truly and richly represents the stories your participants shared, moving you from a flat summary to an interpretive narrative that’s grounded in their own words.
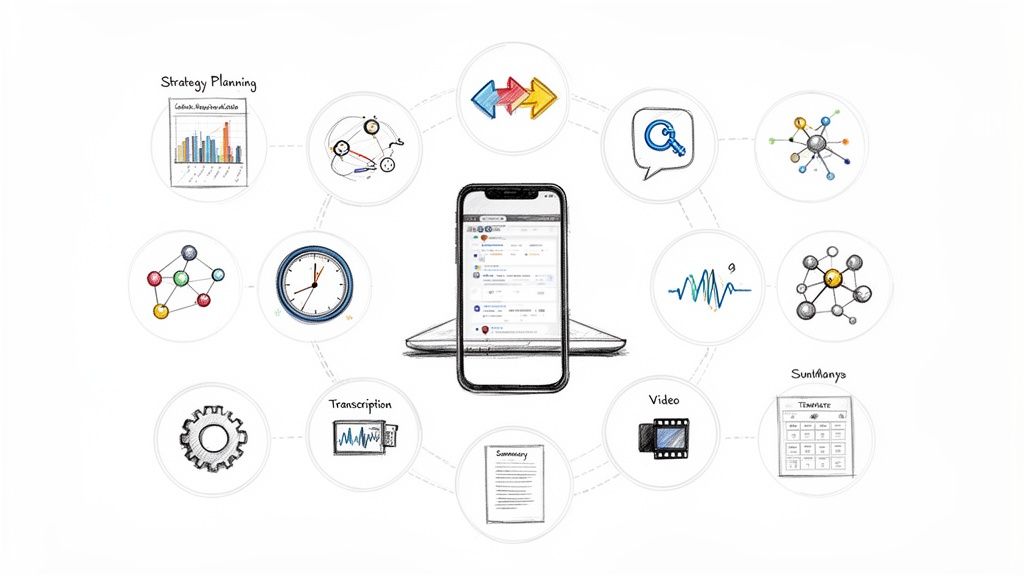
Using Modern Tools to Accelerate Your Analysis
Let's be honest: manually sifting through hours of interview data can be a soul-crushing task. It's often the biggest bottleneck in any research project. The good news is that we now have tools that can handle the grunt work, freeing you up to focus on what really matters—finding the meaning in the data. The trick is to treat these tools as a very capable assistant, not a replacement for your own critical thinking.
This shift toward smarter tools is completely changing the game for qualitative analysis. And the results speak for themselves. Industry reports show that over 90% of organizations that invest in data and analytics for HR see real, measurable benefits like better, faster hiring. This is part of a much bigger trend; you can read more about the future of data analytics across industries and how it’s reshaping decisions everywhere.
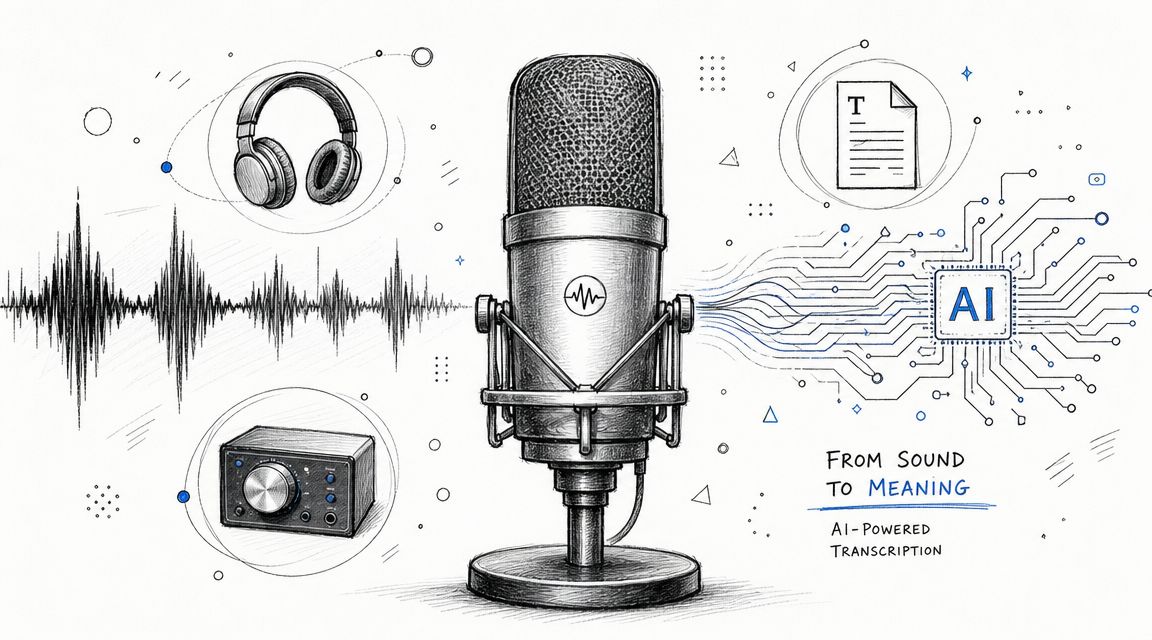
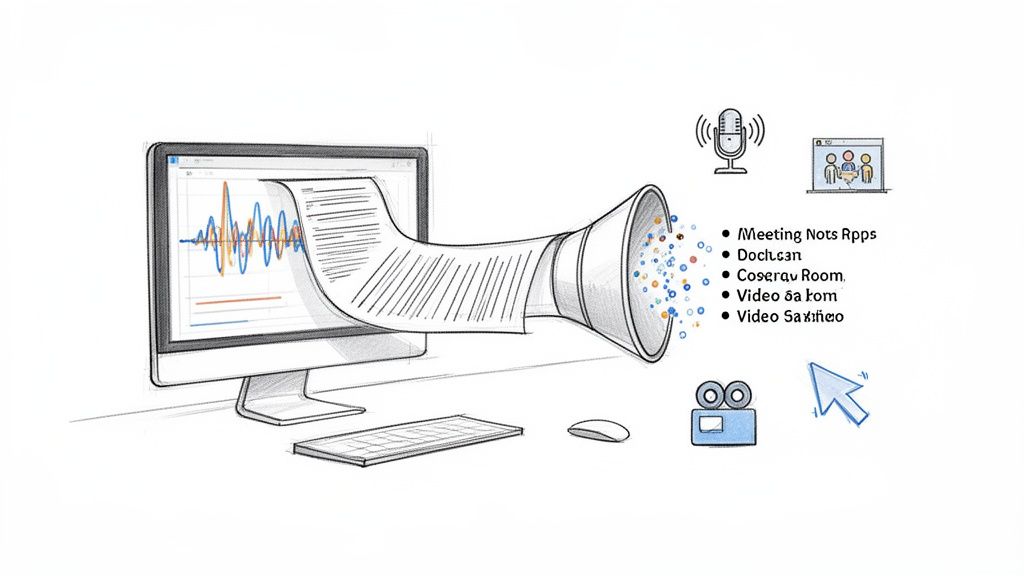
AI-Powered Transcription for Speed and Scale
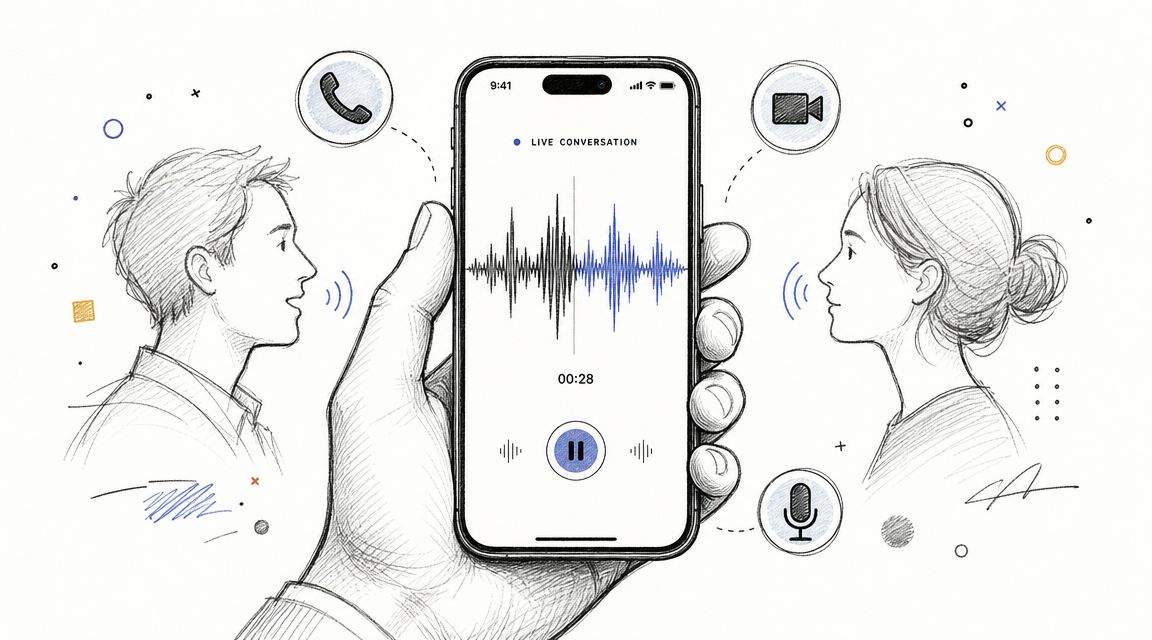
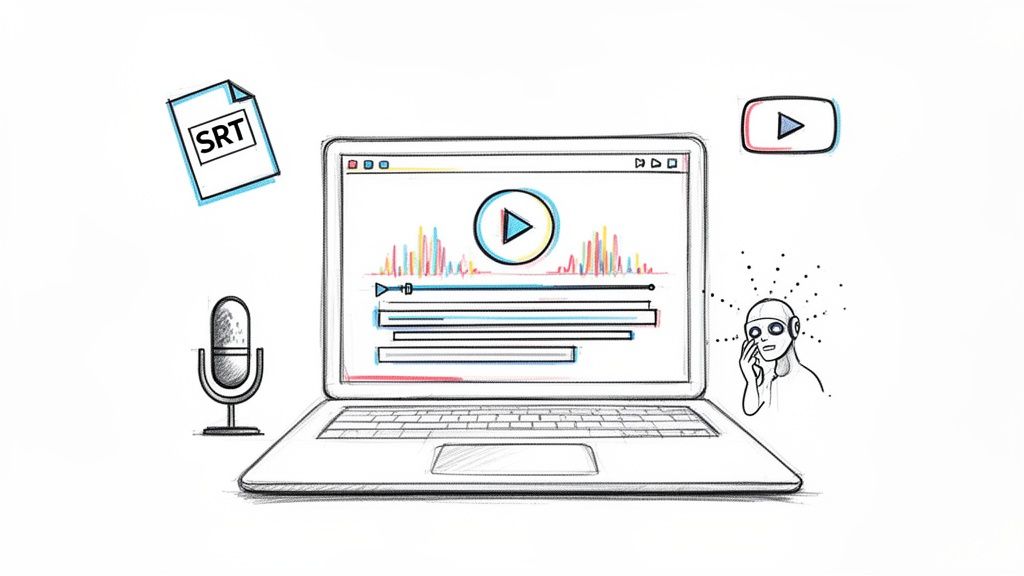
If you're going to make one change to your workflow, automate your transcription. Modern AI services can take hours of audio and spit out an accurate, usable transcript in minutes. This can literally save you days, or even weeks, of tedious manual work.
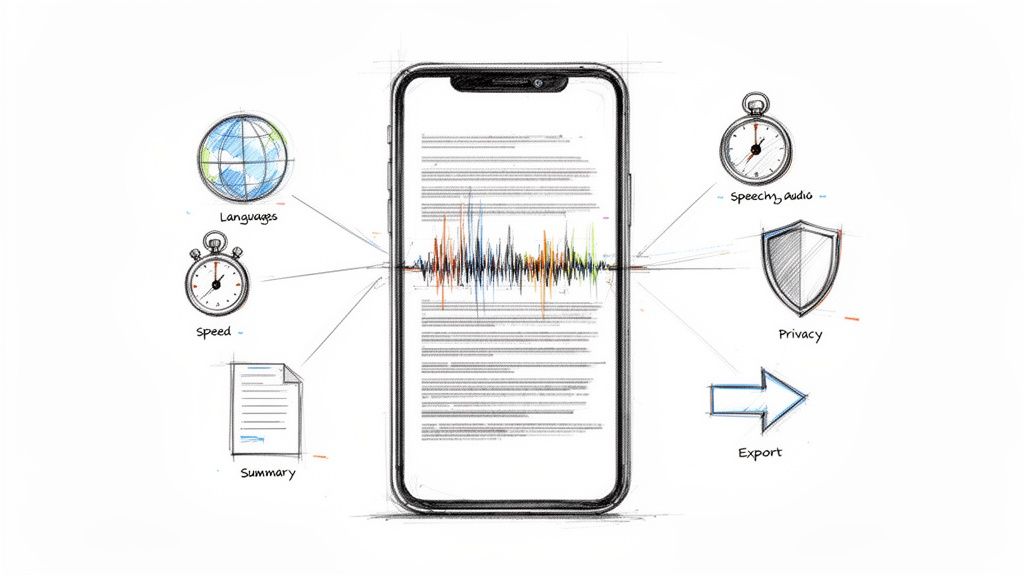
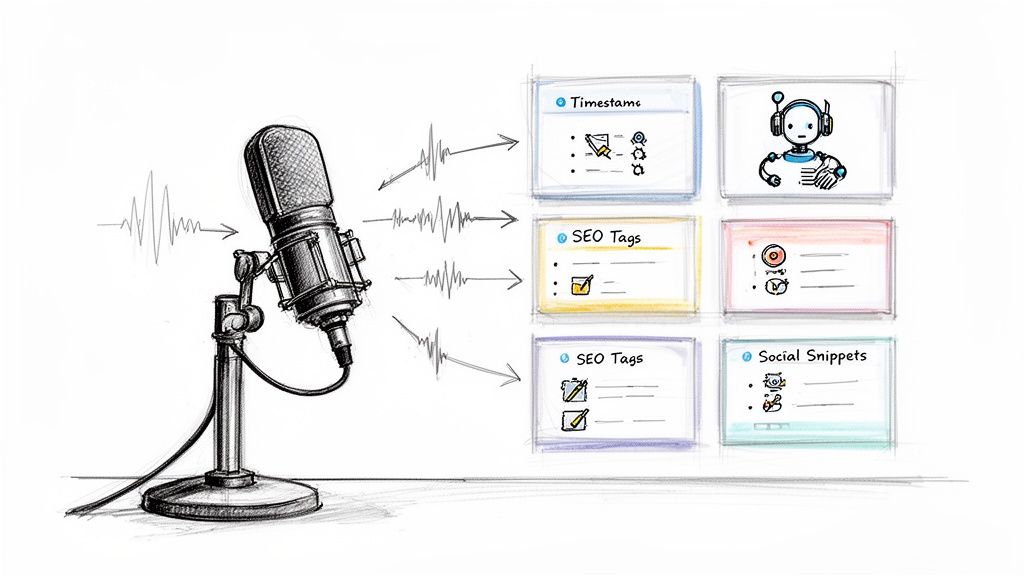
But it’s not just about speed. The best platforms come with features that make the next steps of your analysis so much easier:
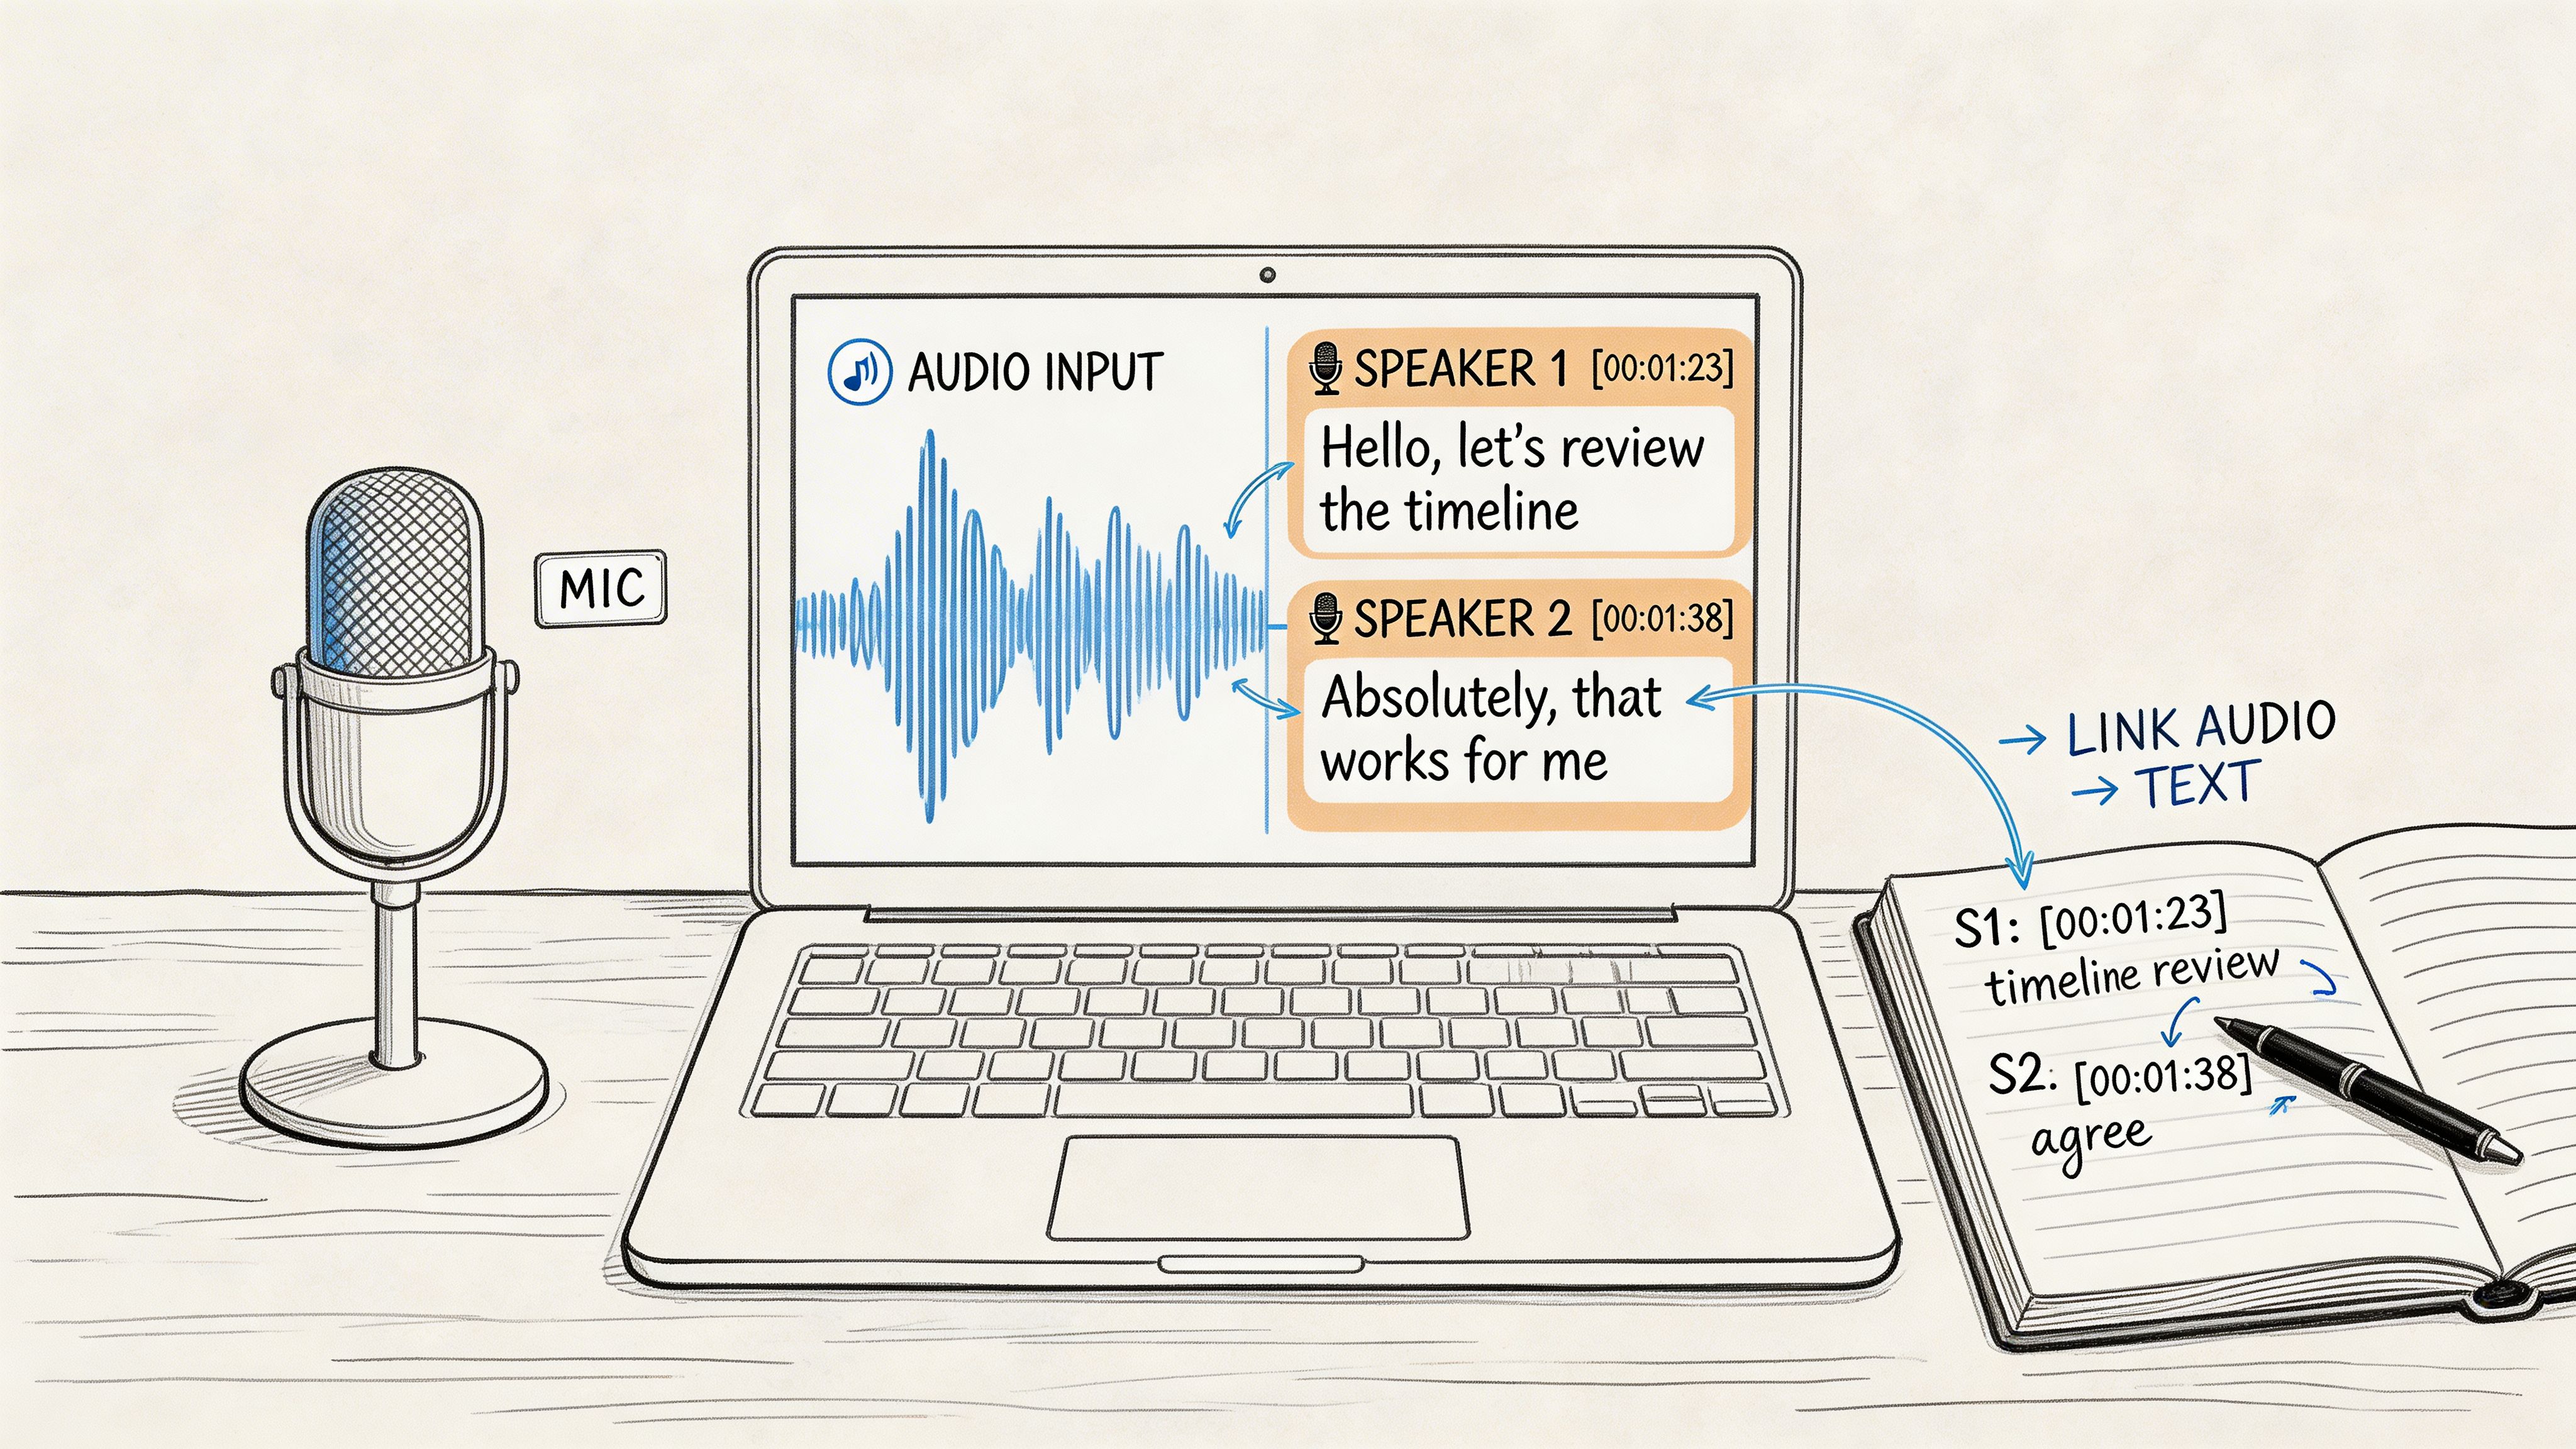
- Speaker Detection: They can automatically figure out who is speaking and label the text accordingly. This alone saves a ton of editing time.
- Timestamps: Every word is linked back to the original audio, so you can instantly jump to a specific moment to check a quote or hear the tone of voice.
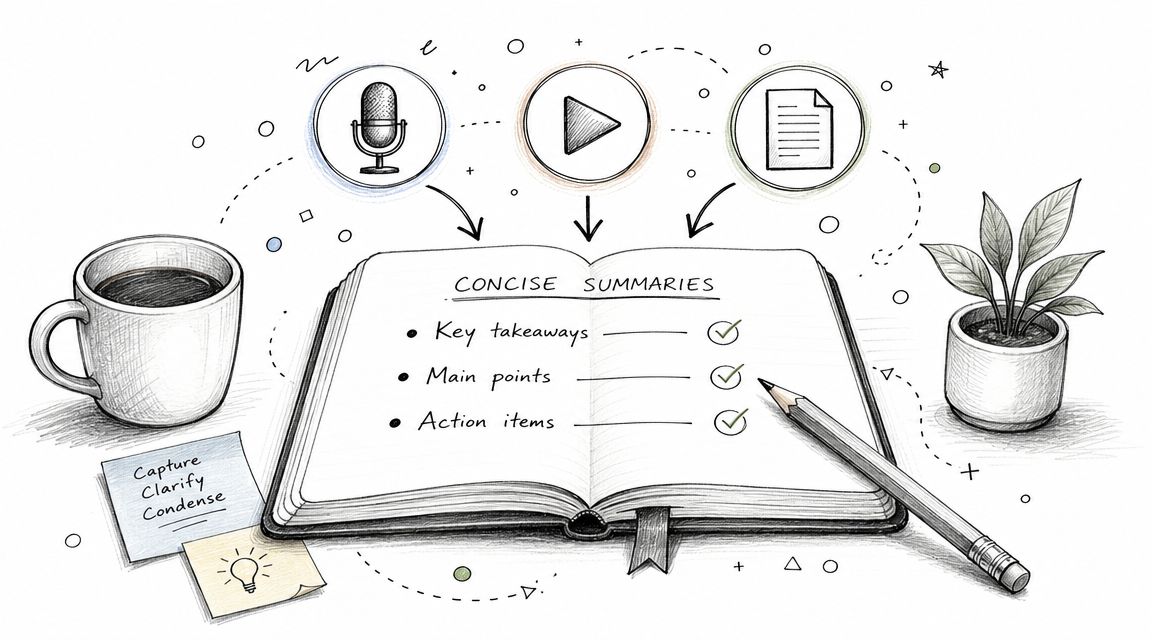
- Initial Summaries: Some tools are now smart enough to generate a high-level summary or pull out key points, giving you a quick overview before you even start coding.
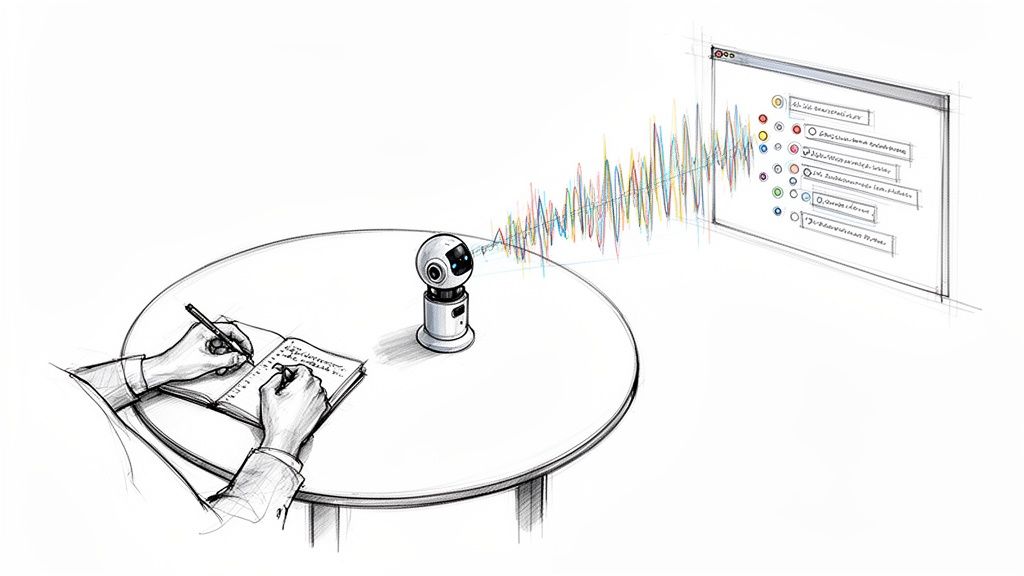
Leveraging Qualitative Data Analysis Software (QDAS)
Once you have your transcripts, you need a central hub to manage everything. This is where Qualitative Data Analysis Software (QDAS) comes in. Trying to juggle dozens of interviews in Word docs and spreadsheets is a recipe for chaos. Trust me.
Platforms like NVivo, ATLAS.ti, or Dovetail are built for this. They keep your project organized and your analysis rigorous. You can import all your transcripts, build your codebook, apply codes with a click, and instantly see every piece of data related to a specific theme.
The real magic of QDAS is how it helps you see connections you’d otherwise miss. You can run queries to find relationships between themes or compare how different groups—say, managers versus individual contributors—talk about the same topic. This is how you move from just describing the data to uncovering deep, actionable insights.
Using AI as an Analytical Assistant
Beyond just transcription, AI is starting to become a true analytical partner. Some tools can now scan your text and suggest initial codes by spotting recurring keywords and concepts.
Think of it as a first draft of your coding. For instance, an AI might notice that participants frequently mention "feedback," "recognition," and "growth" in the same breath and suggest a code like "Career Development." You don't just accept this blindly, of course. But it gives you a fantastic starting point and can highlight potential themes you might not have noticed right away.
The final call on what a code means and how it fits into the bigger picture is still yours. These tools are powerful assistants, but the researcher is—and should be—always in charge.
Getting Your Findings Ready for Prime Time
After hours of coding and seeing themes emerge, it’s easy to feel like you're at the finish line. But the truth is, the analysis isn't really done until you've kicked the tires on your conclusions and figured out how to share them in a way that resonates. This last part of the process is all about building credibility and turning your hard-won insights into a story that actually inspires people to act.
I think of this stage in two parts. First, you have to validate your interpretations to make sure they're solid and not just a reflection of your own biases. Then, you need to craft a narrative that brings all that data to life for everyone else.
Strengthening Your Research with Validation Techniques
Before you even think about putting a slide deck together, you need to be confident in what you've found. Validation adds that necessary layer of rigor, proving your conclusions are trustworthy. It’s like a peer review for your own work.
I consistently rely on two simple but powerful techniques: inter-rater reliability and member checking. Each one tackles credibility from a different, yet equally important, angle.
Inter-Rater Reliability: This just means asking a colleague to independently code a small chunk of your data—say, 10-15% of the interviews—using the codebook you created. Afterwards, you compare their codes to yours. You're not aiming for a perfect 100% match, but a high level of agreement demonstrates that your codes are clear and your interpretations are consistent, not purely subjective.
Member Checking: This is probably the most direct way to know if you've gotten it right. You go back to a few of your original participants, share a summary of the themes you found, and ask them, "Does this ring true to your experience?" Their feedback is pure gold for confirming that your analysis genuinely reflects their point of view.
This step is absolutely crucial. It’s your final check against misinterpretation. When a participant says, "Yes, that's exactly what I was trying to get at," you know you've nailed it. It shifts your work from being your interpretation to a co-created understanding.
Crafting a Compelling Narrative
With your findings validated, the next hurdle is communication. A dry report filled with code definitions and theme descriptions will put anyone to sleep. Your job now is to become a storyteller, weaving your data points into a narrative that’s both insightful and unforgettable.
Start by outlining the main story you want to tell. What’s the single most important message that came out of all those conversations? Frame your presentation around that central idea, using your themes as the chapters of your story.
To give your narrative real punch, use direct quotes from your participants. A well-placed quote can bring a theme to life far better than a paragraph of your own explanation ever could. It injects that critical human element, reminding your audience that there are real people and experiences behind the data. Honing the skill of pulling key quotes is a lot like learning how to take effective meeting notes; it's all about spotting and elevating the most vital information.
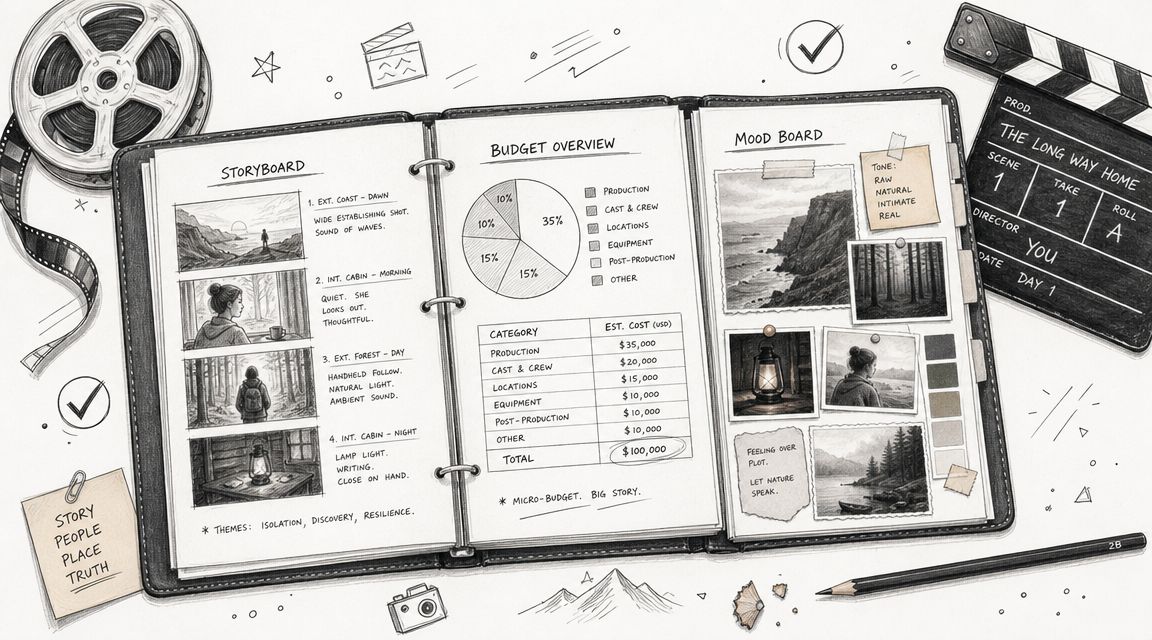
Using Visualizations to Make Insights Click
Finally, never underestimate the power of a good visual. You might be intimately familiar with your themes, but your audience is seeing them for the first time. Visuals can make complex relationships and abstract ideas instantly digestible.
And please, don't just default to another bar chart. Get creative with visuals designed for qualitative data.
Effective Visualization Options
At the end of the day, the goal of analyzing interviews is to produce insights that drive real-world change—much like how actionable data analytics can propel a business forward. By validating your findings and presenting them as a clear, compelling, and visually engaging story, you ensure your hard work leads to genuine understanding and meaningful action.
Frequently Asked Questions About Interview Analysis
Even with a solid plan, analyzing interview data often feels more like an art than a science. It’s a process full of judgment calls, unexpected discoveries, and that nagging feeling of, "Am I even doing this right?" Let's break down some of the most common questions that come up during this complex but incredibly rewarding work.
How Do I Handle a Bad Transcript?
We’ve all been there. You get a transcript back from an AI service, and it's a mess—misattributed speakers, mangled jargon, or huge chunks marked as "inaudible." It's frustrating, but it doesn't have to torpedo your analysis.
First, you need to triage the situation. If the errors are minor and scattered, you can probably clean them up with a single listen-through of the original audio, correcting the text as you go. But if the transcript is a total disaster, often because of poor audio quality, don't waste hours trying to salvage it. A better strategy is to manually transcribe only the most critical segments yourself.
My Personal Takeaway: Never, ever delete the original audio file. A transcript is flat; it misses the sarcasm, hesitation, or excitement in a person's voice. Your audio is the ultimate source of truth, and you’ll need it to clarify those ambiguous moments.
How Can I Minimize My Own Bias?
This is the big one—the question that keeps conscientious researchers up at night. Our own experiences and beliefs can subtly color how we interpret what people say, pushing us to find the patterns we expect to find. The goal isn't to become some kind of perfectly objective robot; that's impossible. The goal is to be aware of your subjectivity and actively manage it.
A great first step is to write a positionality memo before you even start coding. This is just a short, honest reflection on your own background, assumptions, and relationship to the research topic. By getting it all down on paper, you become more conscious of the lens through which you're viewing the data.
Another powerful technique is to deliberately look for disconfirming evidence. As you start forming theories, actively hunt for quotes or instances that contradict them. If your ideas still stand strong after you’ve tried to poke holes in them, you can feel much more confident that you're onto something real.
What's the Ideal Number of Interviews to Analyze?
There's no magic number here, and you should be wary of anyone who gives you one. The right number of interviews depends entirely on your research goals and the depth of the information you're gathering. The guiding principle is thematic saturation.
Saturation is simply the point where new interviews aren't telling you anything new. You start hearing the same stories, the same pain points, the same ideas—just from different people. Your set of codes stops growing.
- For a very specific, narrowly-focused study, you might hit saturation after just 10-12 rich, in-depth interviews.
- For a broader, more exploratory project, you might need 20-30 interviews or even more to feel confident you've covered the landscape.
Forget the number. Listen to your data. When it stops surprising you, you’re probably there.
What if Participants Contradict Each Other?
Contradictions aren't a problem; they're a finding! When you hear conflicting perspectives on the same topic, it’s a bright, flashing sign that you've uncovered a point of tension or complexity that's worth digging into. Your job isn't to play referee and decide who's "right." It's to figure out why their views are so different.
Start looking for patterns in the disagreements.
- Do managers and their direct reports describe the same process in completely different ways?
- Do new employees see a challenge that long-term staff members don't even notice anymore?
Analyzing these friction points often leads to your most powerful insights. It reveals how different groups can experience the exact same reality in fundamentally different ways.
Ready to stop wrestling with manual transcription and start finding insights faster? Whisper AI transforms your audio and video interviews into accurate, speaker-labeled text in minutes. With automatic summaries and support for over 92 languages, it’s the perfect assistant for any researcher. Try Whisper AI today and turn your conversations into conclusions.